This report outlines a framework to quantify the liquidity, solvency, and profitability of publicly traded Bitcoin miners. It uses methods practiced by traditional financial professionals to quantify the financial health of public miners and calculates a “Miner Score” to rank them based on four critical metrics pulled directly from 10-Q and 10-K fillings.
In 2022, a spotlight was shined on the financial health of publicly traded Bitcoin mining firms. Excessive leverage parlayed with higher interest rates, mining difficulty, energy costs, and a broad-based decline in asset prices all contributed to the financial distress shown across the Bitcoin mining industry. In order for investors to effectively navigate this environment, proper analysis of the most recent financial statements of public Bitcoin miners is crucial. This report utilizes methods practiced by traditional financial professionals to quantify the financial health of public miners and calculates a “Miner Score” to rank them based on the following criteria:
This analytical framework is limited by the timing of available data and is only intended to be used for education. The results of this study are solely based on subjective data and are not an advertisement to buy, sell or hold any particular security
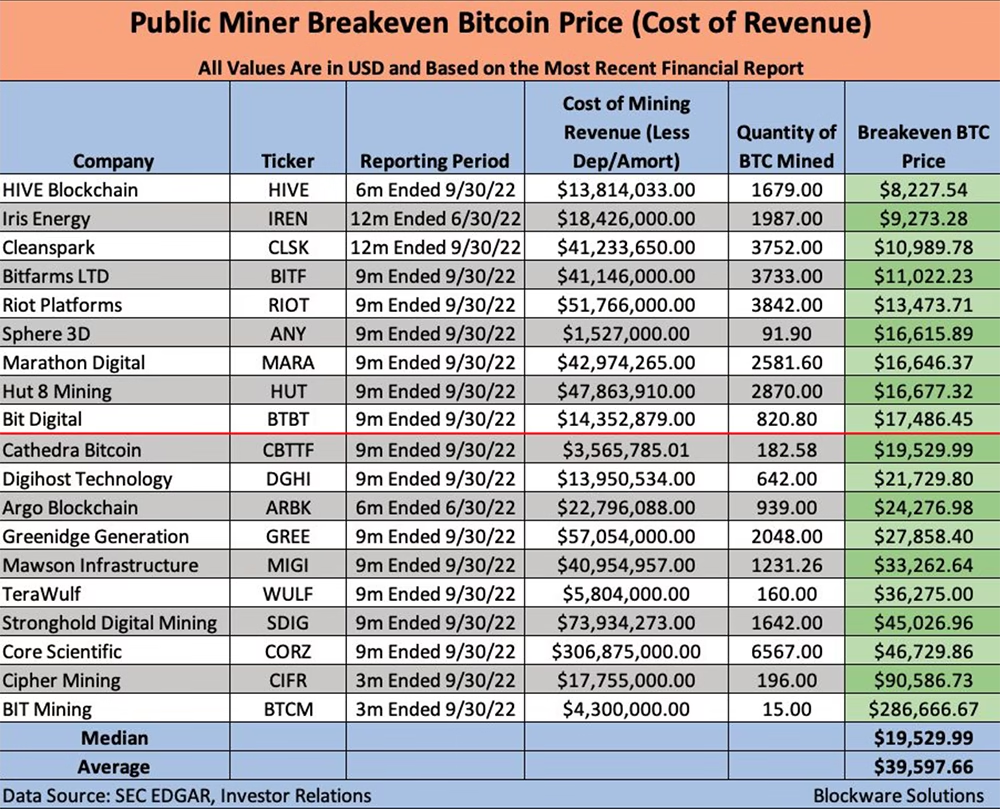
The Cost of Revenue (CoR) is reported on the income statement of public companies. For firms who solely mine BTC, we either used the CoR given at face value if depreciation was already removed, or subtracted the depreciation expense provided in the filing. Companies who have other revenue sources generally describe their Cost of Revenue by revenue source in the footnotes.
By dividing the direct Cost of Mining Revenue by the quantity of BTC mined over a given period, we can approximate the breakeven (BE) price of the BTC mined. In theory, if BTC is above their BE price, then that firm is in profit on the BTC mined over the period. It should be noted, however, that numbers used in financial statements are backward-looking estimates. Furthermore, solely looking at the Cost of Mining Revenue does not take into account other operating costs such as depreciation, impairment, and administrative expenses.
The table on the right shows the breakeven Bitcoin price for the given period calculated using CoR. This data is sorted lowest to highest by BE price, and includes a red line to show companies with a BE below BTC’s 9/30/22 closing price of $19,426.11.
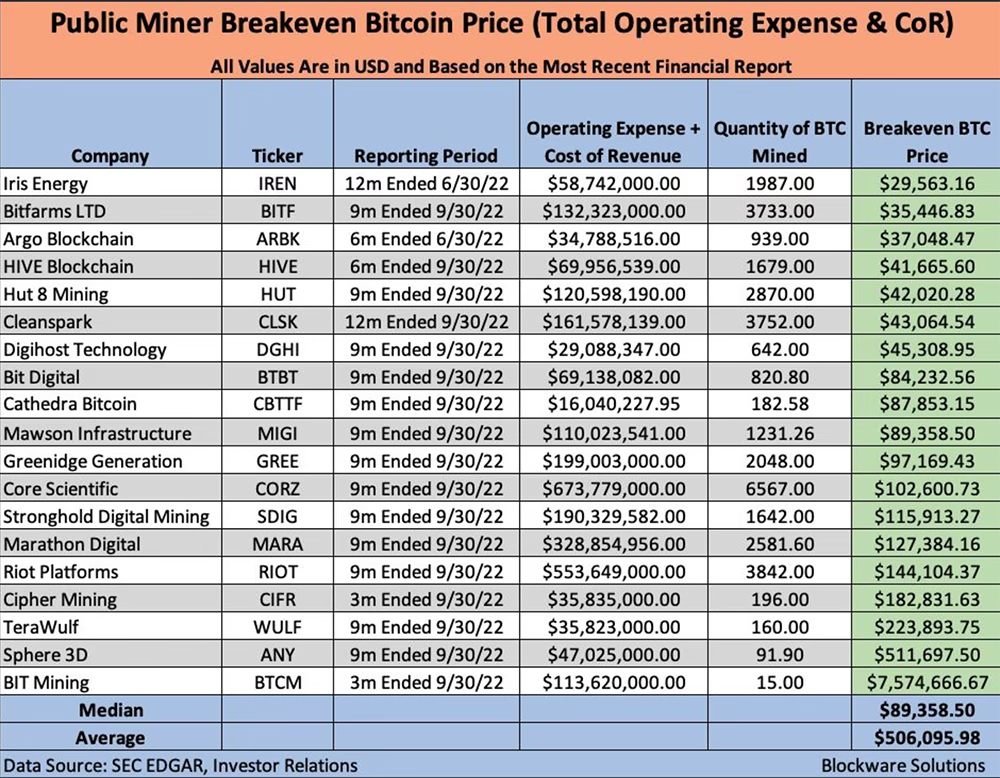
As mentioned in the previous slide, instead of calculating the BE BTC price solely using the direct Cost of Revenue, we can add the Total Operating Expense given on the income statement to find the price BTC would need to surpass to cover all expenses incurred through all operational business activities.
The total cost to the firm to produce BTC is going to be higher than the direct cost to mine. Therefore, we’ll tend to see significantly higher BE prices when accounting this way. Furthermore, using total OpEx takes into account other expenses, such as the depreciation of ASICs and buildings, and employee wages.
While this does show the ability of public miners to turn a profit solely from BTC mining, many of these companies also have other revenue sources such as Ethereum staking, hosting, or consulting. For this reason, our team prefers the breakeven prices in the previous slide to determine the true BE price for public miners.
The table on the right shows breakeven Bitcoin prices using Total Operating Expense and CoR for the given period. These values are sorted lowest to highest in the green column. After incorporating total operating expenses, no public miner had a BE price below BTC’s 9/30/22 closing price of $19,426.11.
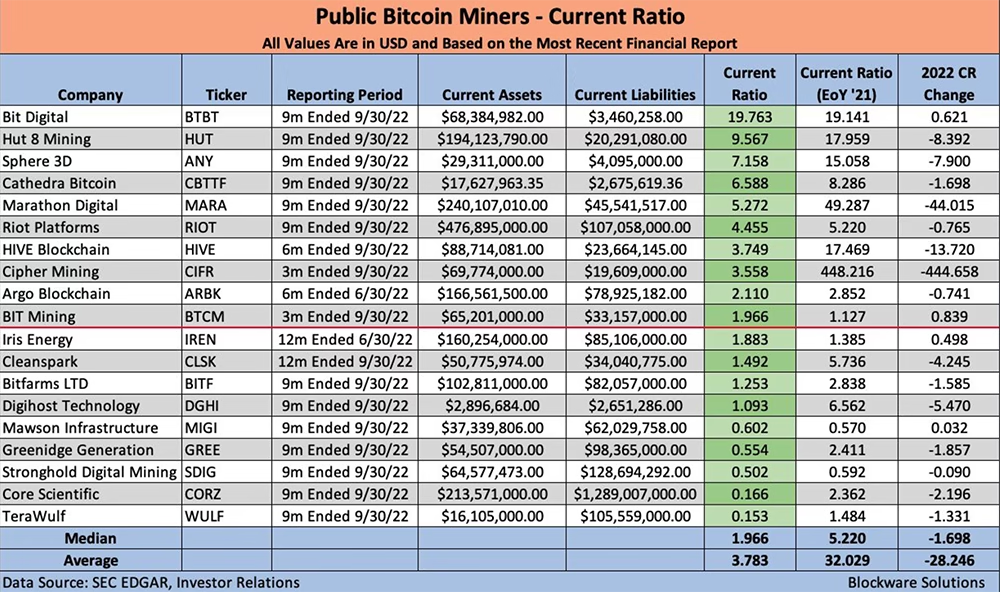
The Current Ratio divides total current assets by total current liabilities to measure the ability of a company to pay its short-term financial obligations. Current assets include things such as cash, accounts receivable, inventory, and short-term investments. Examples of current liabilities would be accounts payable, notes payable, and other short-term debt.
The traditional benchmark for the Current Ratio is 2.0 or greater. This implies that the company has double the amount of current assets than liabilities, and indicates a strong ability to cover short-term debts. But, companies with extremely high Current Ratios are likely not effectively allocating their assets, or don’t have profitable ventures to do so.
Companies like CORZ, GREE, SDIG and WULF are examples of firms who filed for bankruptcy, or began some form of capital restructuring, in late-2022 or early-2023. The low ability for these names to repay debts was displayed by having the lowest Current Ratios in Q3.
The table to the right shows the Current Ratio of public miners, sorted highest to lowest. It also shows how much their Current Ratio grew last year, and a red line showing the median Current Ratio.
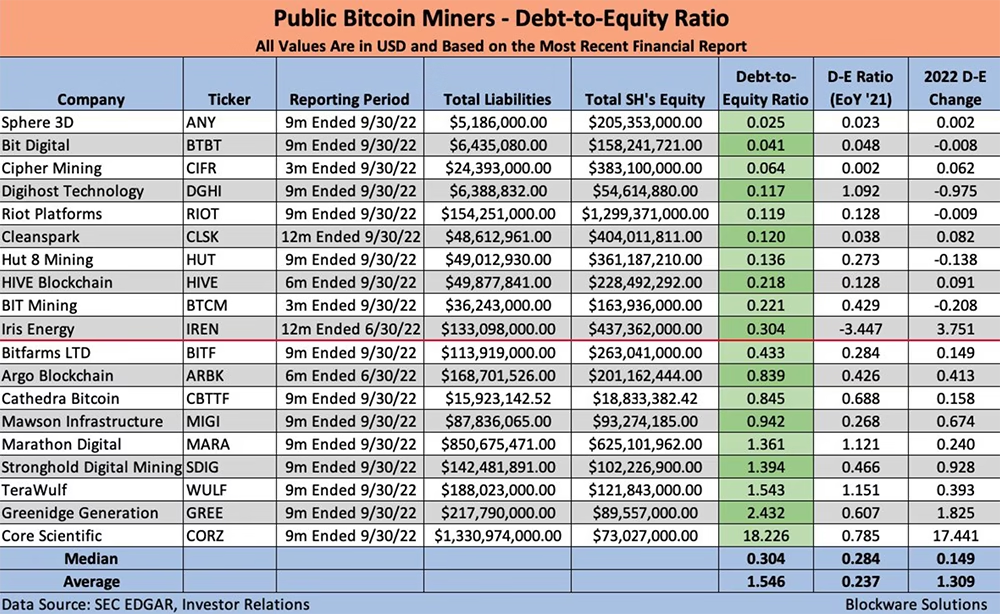
The Debt-to-Equity (D-E) Ratio divides total liabilities by total shareholders equity to show the amount of debt compared to equity financing and retained earnings. Highly leveraged firms will have high D-E Ratios as the total value of liabilities vastly outweighs the value of their equity.
A D-E Ratio in the range of 0.5-1.5 is considered ideal among financial analysts as it shows a healthy reliance on debt supported by significant equity. Generally speaking, a low D-E Ratio indicates a low likelihood of default, but extremely low D-E Ratios could indicate an unhealthy reliance on equity financing.
In December 2022, Core Scientific (CORZ) filed for chapter 11 bankruptcy. Their unhealthy reliance on debt was evident by a D-E ratio nearly 7.5x greater than the next highest in the group in Q3.
The table to the right shows the D-E Ratios of public miners, sorted lowest to highest. It also shows the change in their D-E Ratio over 2022, and includes a red line to show the median D-E Ratio.
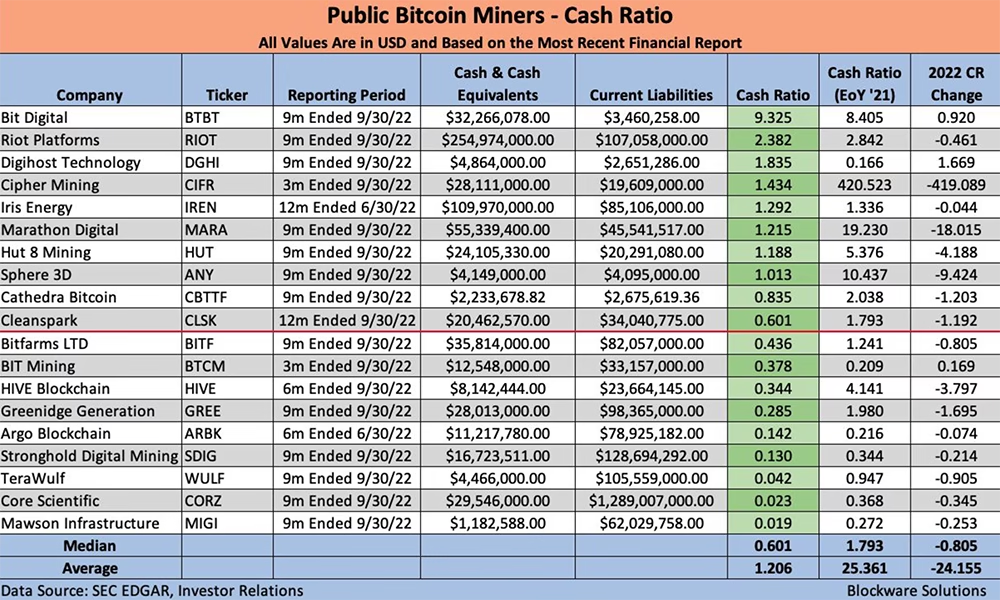
The Cash Ratio is found by dividing the sum of cash and cash equivalents by current liabilities. This ratio measures the firm’s ability to repay short-term obligations solely using cash on-hand.
A Cash Ratio of 1.0 is the benchmark to signify strong liquidity. Extremely high Cash Ratios could indicate that the company has underallocated cash into investments, or that the company has no profitable projects to utilize their cash. Miners with high Cash Ratios were generally liquidating their BTC holdings, and likely capitulating rigs, in 2022.
A low Cash Ratio tells us that the firm is currently unable to cover short-term liabilities without selling assets or liquidating receivables. ARBK, SDIG, CORZ, and MIGI all struggled to repay creditors in 2022 which resulted in bankruptcy, or restructurings to avoid bankruptcy. These names had some of the lowest Cash Ratios in the group.
The table to the right shows the cash ratios of public miners, sorted highest to lowest. It also shows their 2022 Cash Ratio growth and includes a red line to show the median Cash Ratio.
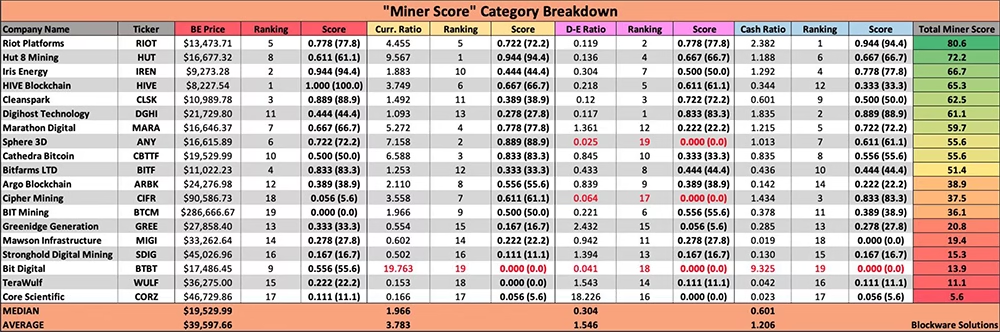
To aggregate this data, and rank the public miners included in this report, our team assigned each company a “Miner Score”. This score calculates the company’s average percentile ranking across the 4 categories: Breakeven Price using Cost of Revenue, Current Ratio, Debt-to-Equity Ratio, and Cash Ratio.
For example, CLSK had the 3rd lowest breakeven BTC price, therefore CLSK received a score of 16/18 (0.89 or 89) in this category. BTCM had the highest BE price, giving it a score of 0/18 in this category. A perfect Miner Score of 100 would mean that company held the #1 ranking across all 4 categories.
The table below breaks down the percentile rankings (category score) across each of the 4 categories. They were then averaged to calculate the “Total Miner Score” for each company. Cells with red text show instances when scores were adjusted to remove misleading results. Firms who had a Current Ratio >10.0, D-E Ratio 5.0 were adjusted downwards.
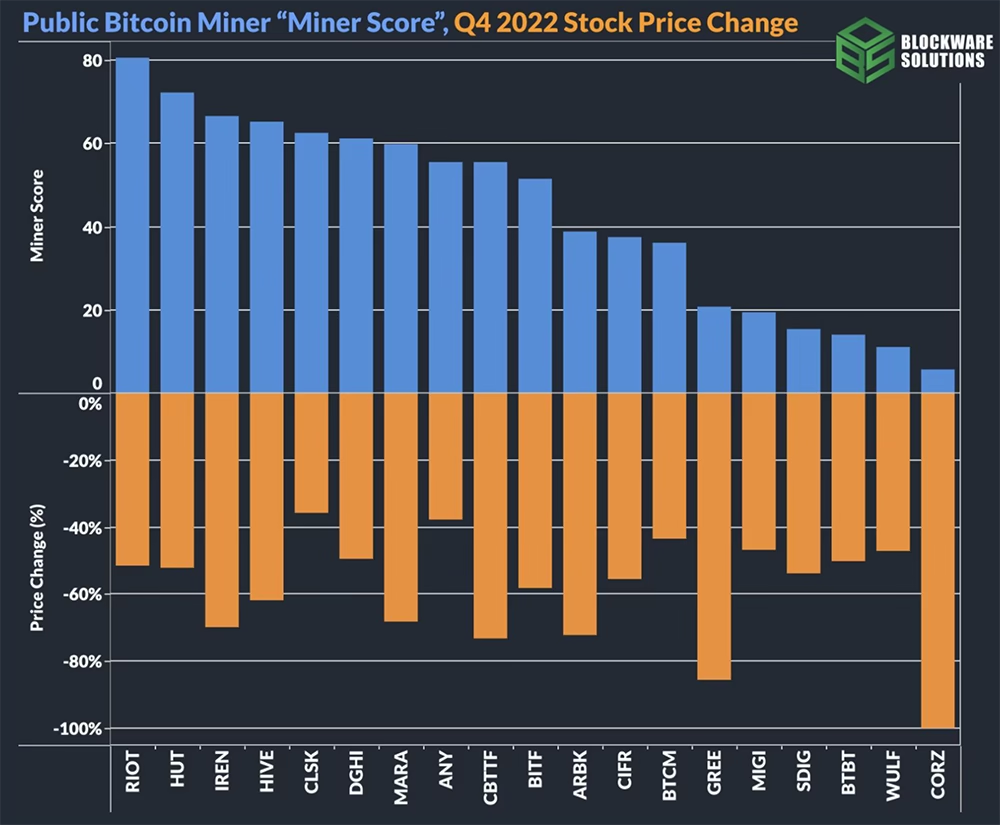
The chart on the right displays the Miner Score of each company overlaid with their stock price return in Q4 2022. As you can see, all of these stocks were sold aggressively in the 4th quarter. However, Cleanspark (CLSK) was down the least at -35.9%.
More interestingly, the financial data used to formulate this report largely came from Q3 earnings reports. Core Scientific (CORZ) received the lowest Miner Score (5.6) as of September 30th and ultimately filed for Chapter 11 bankruptcy on December 20th. As a result, CORZ was delisted from the Nasdaq, resulting in a stock price decline of 100% in Q4. Other names with low Miner Scores in Q3 also ran into trouble in Q4 2022 or Q1 2023. For example, WULF and GREE both announced debt restructurings, and SDIG announced a debt-to-equity swap.
The names with the highest Miner Scores tend to be institutional favorites and generally offer the most liquidity. Clearly, by implementing this analytical framework investors can more effectively manage risk and make better informed investment decisions.
Using any single accounting ratio, solely looking at breakeven prices, or only viewing Miner Scores is generally not the most practical way to apply financial analysis in the real world. The fundamental analysis highlighted in this report uses backward-looking data, while equity price action is based on forward-looking mechanisms. Understanding the financial health of the firms is certainly important, but we must also utilize technical analysis within the greater macroeconomic context to understand how institutions are currently viewing risk.
This report proves that despite all operating with essentially the same objective, to mine Bitcoin at the lowest possible cost, not all public miners are created equal. Investing in public miners is just one of the many avenues to gain directional exposure to Bitcoin, but we prefer to mine Bitcoin for ourselves. Mining Bitcoin can allow you to earn cash flow while eliminating much of the counterparty, market, and credit risk associated with simply buying shares of public miners.
Market contagion from the forced selling of ASICs by large miners, and overall high fear levels, have led to large declines in ASIC pricing. These discounts provide a great opportunity to start mining now.
Having sold over 350,000 ASICs since 2017, Blockware Solutions played a pivotal role in bringing Bitcoin mining to North America. Buying or hosting rigs with Blockware Solutions eliminates the difficulty of sourcing scalable energy, procuring ASICs, and building large facilities all by yourself.
If you’re an individual or institution interested in buying or hosting rigs with a trusted partner like Blockware Solutions, or would simply like to learn more, you can request a quote here or reach out to the team at [email protected].


