Timing is arguably the most important factor when it comes to success with Bitcoin mining. You can do everything else right – purchase efficient ASICs, source low-cost power, and maintain high uptime – but if you enter the market at the wrong time you will have less success than you otherwise would.
This is different from spot Bitcoin, where “time in the market” is far more important than “timing the market.” Even if you buy a market top, you can simply hold your Bitcoin until the next cycle; a strategy famously dubbed as “HODL’ing.”
This report examines the quantitative and qualitative relationship between the price of Bitcoin and the network Hashrate to determine when is the most opportune time to start mining Bitcoin. Price and Hashrate are the two most dominant inputs when it comes to Bitcoin mining profitability – mapping out the relationship between the two, what variables impact each, and related trends across Bitcoin cycles will provide key insights into the nature of Bitcoin mining.
Before diving into the weeds of hashrate, we need to understand the ASIC market – its origins, historical trends, and what the future of Bitcoin mining hardware will look like.
ASIC stands for Application Specific Integrated Circuit. These are computers built for the sole purpose of mining Bitcoin – and they do so far more effectively than your average GPU.
In the early days of ASICs each machine was orders of magnitude more powerful and efficient than its predecessor. Nowadays the marginal efficiency gains for each new ASIC is diminishing.
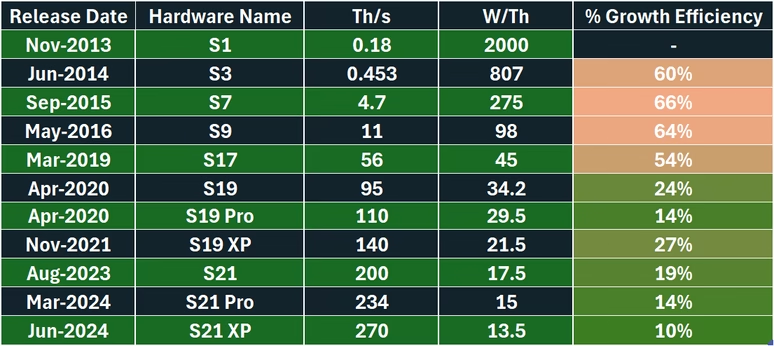
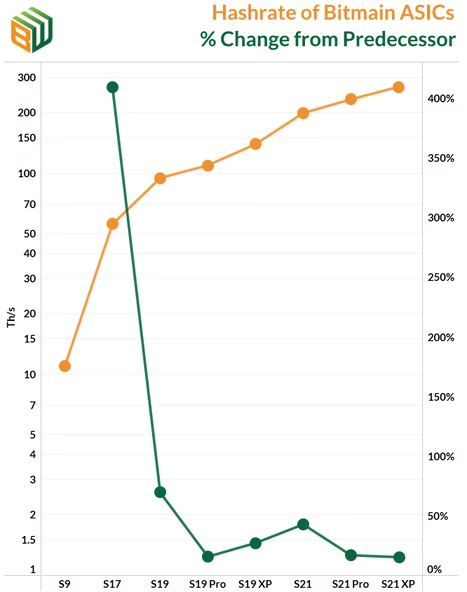
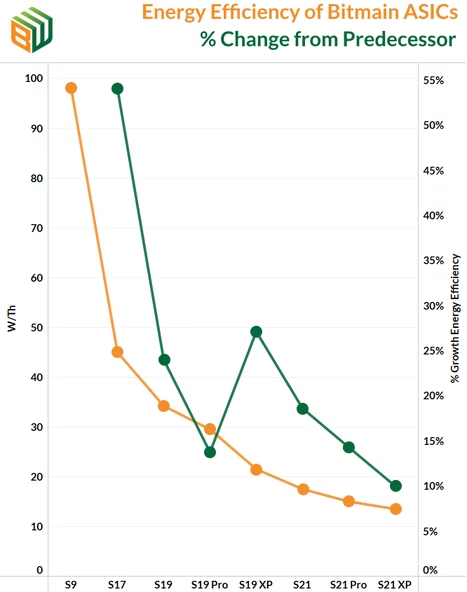
The chart on the left shows the hashrate of new Bitmain ASICs (orange) and the % difference from the preceding ASIC. The chart on the right offers the same depiction except with energy efficiency. The long-term trend is clear: each new ASIC is becoming more powerful and more efficient, but to a lesser degree.
‘ASIC Commoditization’ has three key effects on the Bitcoin Mining industry
Because improvements in ASIC technology is linear, the release of new-generation ASICs does not immediately make previous models obsolete. Older models can still operate profitably so long as they have a low cost of power. This allows ASICs to maintain value on the secondary market for years after release.
The total hashrate of the Bitcoin network is growing, but at a slowing rate, due to diminishing marginal gains in ASIC hardware.
In order for hashrate to increase by 100x, it’s no longer possible for Bitmain to release an ASIC that is 100x more efficient at producing hashes. Rather, physical energy production and mining infrastructure has to grow by 100x.
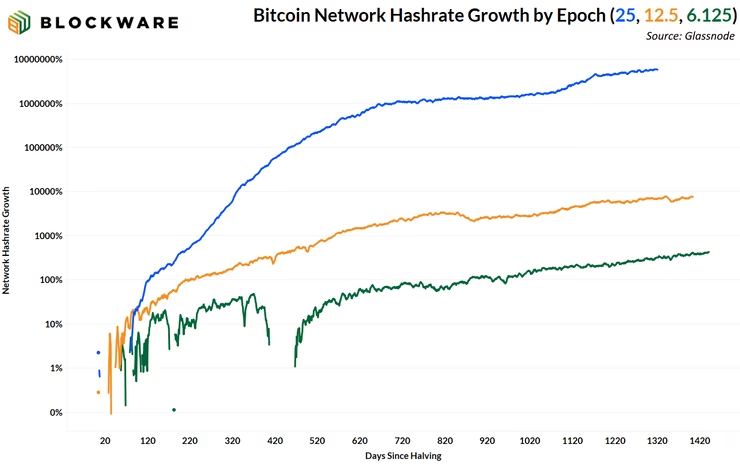
In the early days of Bitcoin hashrate grew at a tremendous pace, increasing by more than 11 orders of magnitude between 2009 and 2014. In the past ten years hashrate has grown by just under 5 orders of magnitude, and just over 1 since the 2020 halving. Hashrate delta is declining quickly. Viewing Hashrate in logarithmic scale makes this readily apparent.
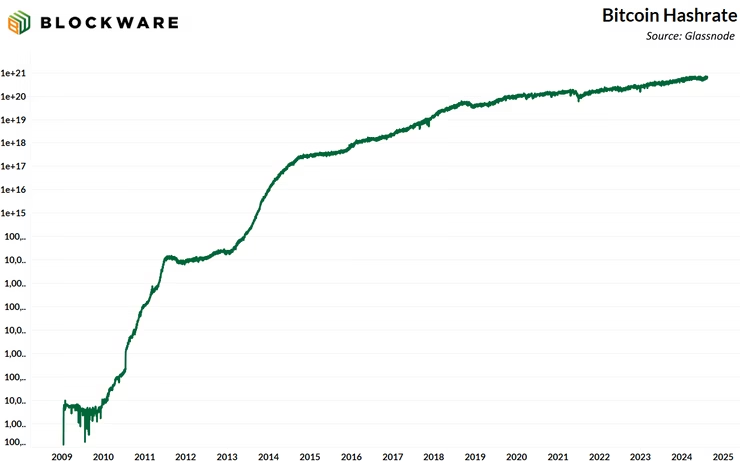
2012-2016: 5,800,000 %
2016-2020: 7,700 %
2020-2024: 437 %
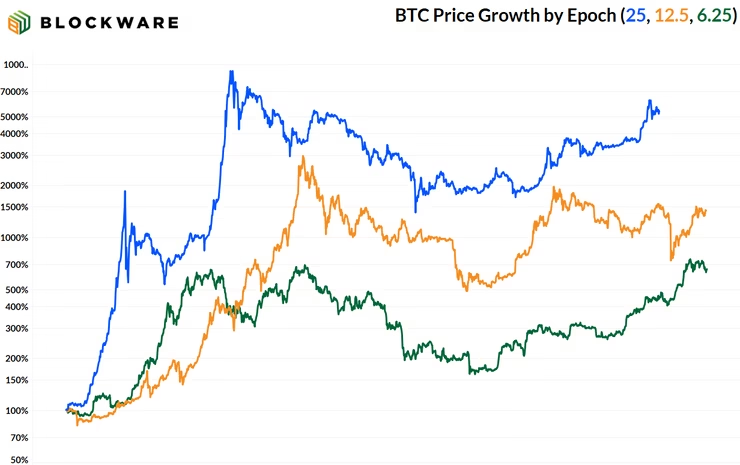
2012-2016: 5,415 %
2016-2020: 1,449 %
2020-2024: 660 %
Hashrate stagnates as miners with inefficient ASICs and/or high electricity costs become unprofitable, and ultimately unplug their machines. Increased BTC sell pressure as struggling miners deplete treasury reserves in an attempt to stay afloat.
After struggling miners have fully capitulated, the BTC price responds to the decrease in sell pressure with violent moves to the upside. Hashrate begins to rise as a post-halving equilibrium is discovered, and also as new-generation ASICs get plugged in. The increase in the price of BTC and the corresponding increase in mining profitability results in a rotation of capital deployment from spot BTC into mining (ASICs and/or infrastructure). This causes ASIC prices to rise dramatically.
The rotation of capital from spot BTC to mining causes a twofold negatvie catalyst on mining profits as less flows into spot BTC results in a price correction. Simultaneously, Hashrate increases as mining investments made during the bull market begin to materialize.
Hashrate continues to rise in the aggregate as lagged mining investment comes online. There is also a tighter correlation between Price and Hashrate during this phase as a rising Price means less cost-effective miners to turn there machines back on as the economics become profitable again.
| Stage in Halving Cycle | BTC Price | Hash Rate |
|---|---|---|
| 1. (Halving) 6 months |  |
 |
| 2. (Bull Market) 12 months |  |
 |
| 3. (Bear Market) 12 months |  |
 |
| 4. (Recovery) emainder of Epoch | |
|
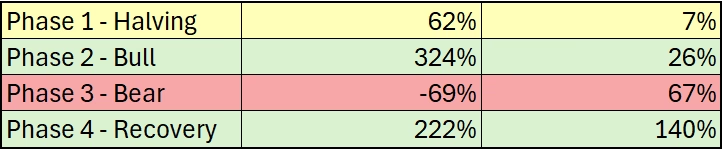
Here are the past two Bitcoin cycles divided into the 4 distinct stages.
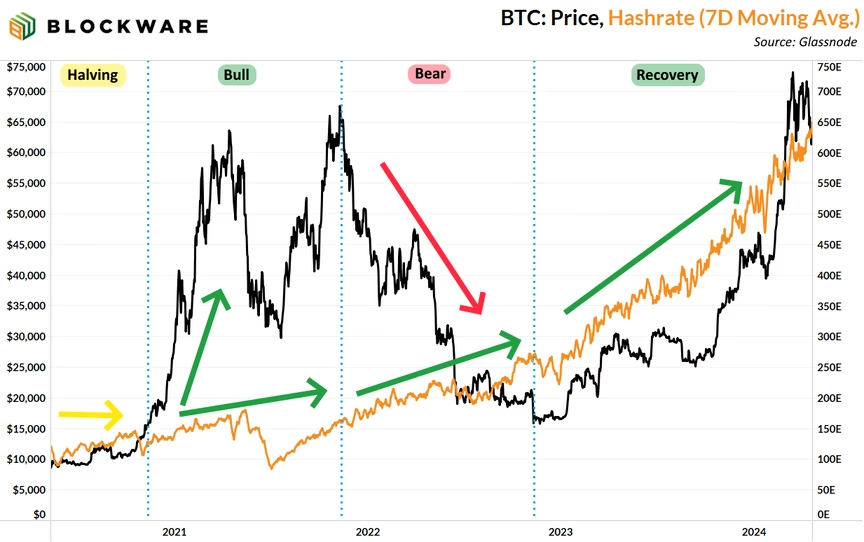
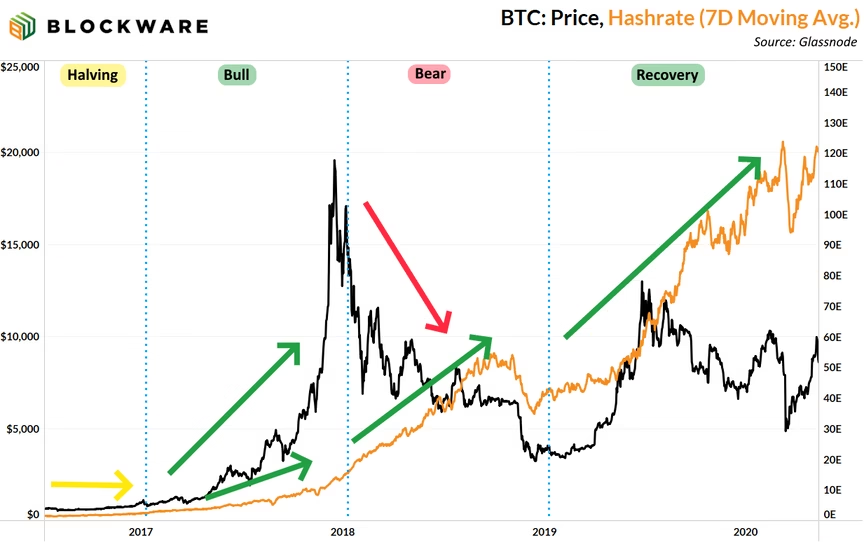
When analyzing Price and Hashrate growth by stage across cycles, three key points stick out:
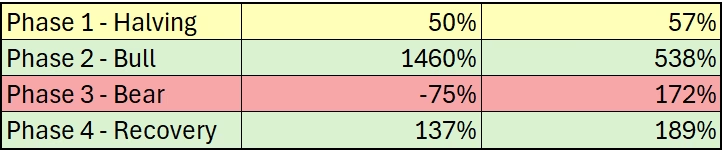
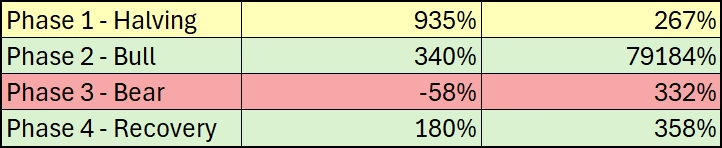
Growth in hashrate following price bull markets is indicative of the responsiveness of Bitcoin miners – a willingness to adapt to changing circumstances. Not only are they responsive to the upside, but they also respond to declines in the price.
The ‘Hash Ribbons’ metric does a great job at illustrating this dynamic relationship between Price and Hashrate. The red lines on this chart indicate when the 30-day moving average of hashrate is below the 60-day moving average. In other words, times when there is a “miner capitulation” , identifiable by a net decrease in hashrate. Hash ribbons are most common after halvings and during times in which the BTC price is going down.
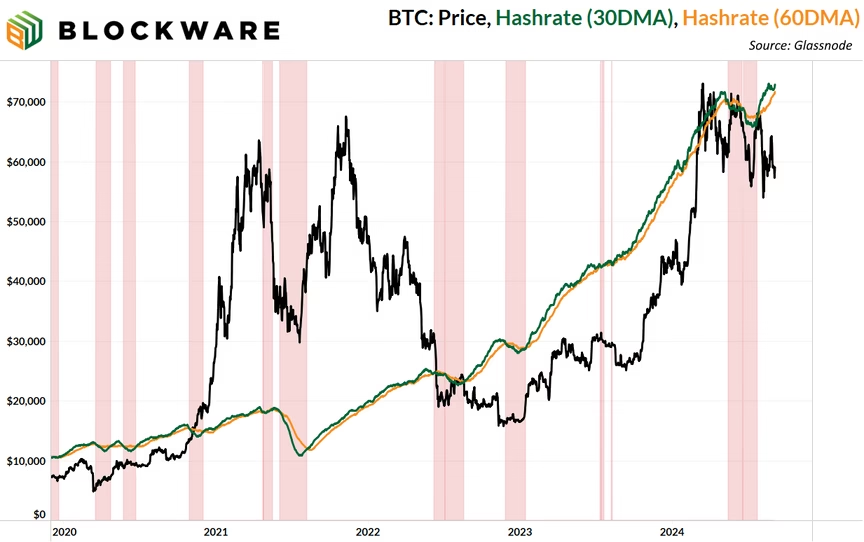

The majority of Hashrate growth taking place within phases 3 and 4 of the latest Bitcoin cycle is indicative of the effect that ASIC commoditization is having on the industry. Miners are responsive to increases in the Bitcoin price, but it is taking a longer amount of time to see this manifest into a corresponding rise in Hashrate.
This “Hashrate stickiness” occurs because a substantial rise in Hashrate can only be achieved through the development of physical infrastructure and real world energy – components which require time and labor. The Bitcoin price can increase by many multiples in short-order while Hashrate growth of equal magnitude takes much longer.
Therein lies the opportunity…
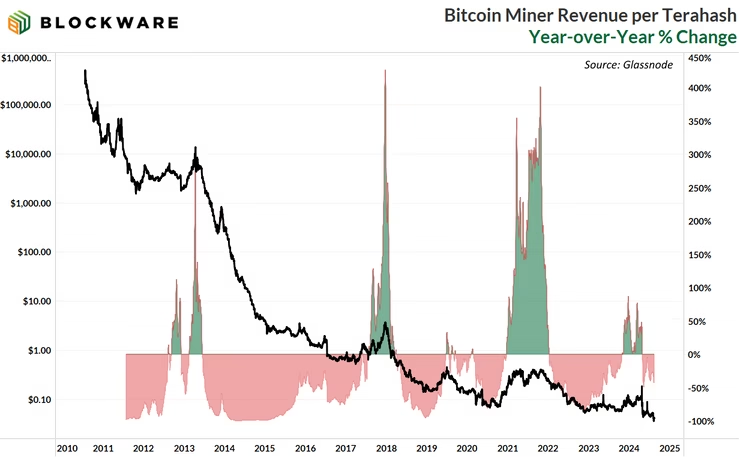
The inability for Hashrate to grow at the same pace as Price creates windows of time in which mining profitability explodes. In each of the past three bull cycles, Price outgrowing Hashrate resulted in a peak year-over-year increase in mining profitability (Hashprice) of more than 300%.
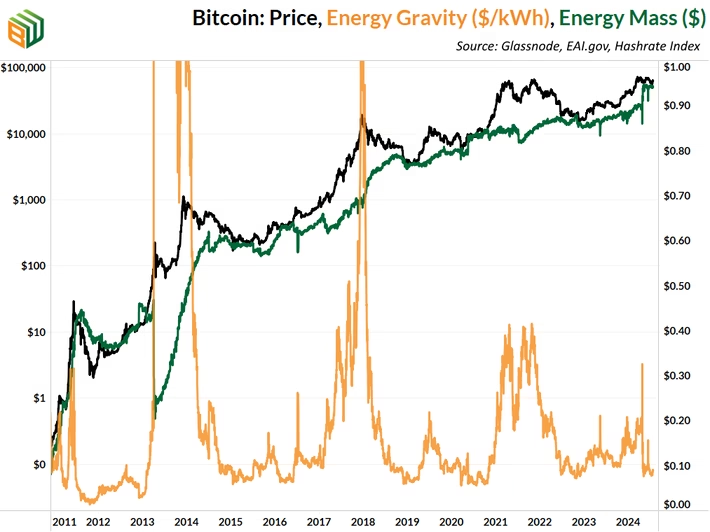
You can also see these explosive movements when looking at Blockware’s flagship metric: “Energy Gravity.” This is similar to Hashprice in that it measures mining profitability. The difference is that this factors in ASIC efficiency and global energy prices to measure profitability with “Energy” as the input, rather than “Hash.”
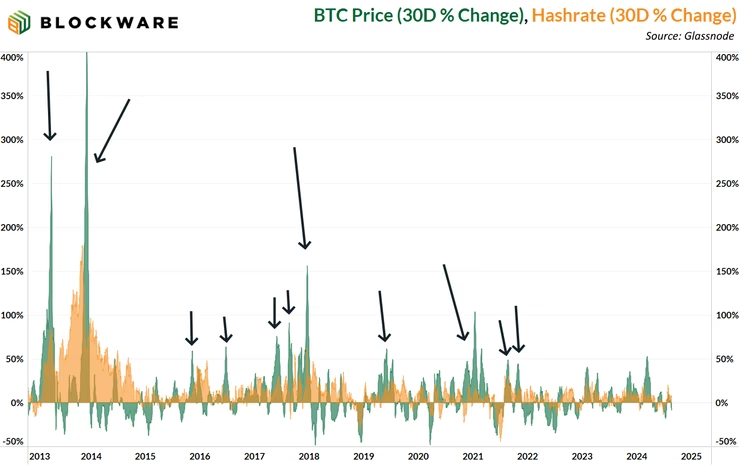
This chart zooms in further, looking at the month-over-month change in Price vs Hashrate. This illustrates exactly how narrow and forceful the windows of rising mining profitability are.
The black arrows denote months when Price (green) is growing faster than Hashrate (orange). These months are scattered, most often occur 6 to 12 months after halvings.
Let’s take these trends and apply them to the present Bitcoin cycle to get a reasonable estimation of future profits for Bitcoin miners using the latest-generation ASICs. The purpose of this case study is not to speculate on BTC price action. Rather, it’s to see how Bitcoin mining will perform in different scenarios. Below are the assumptions we’ll use for the case study:
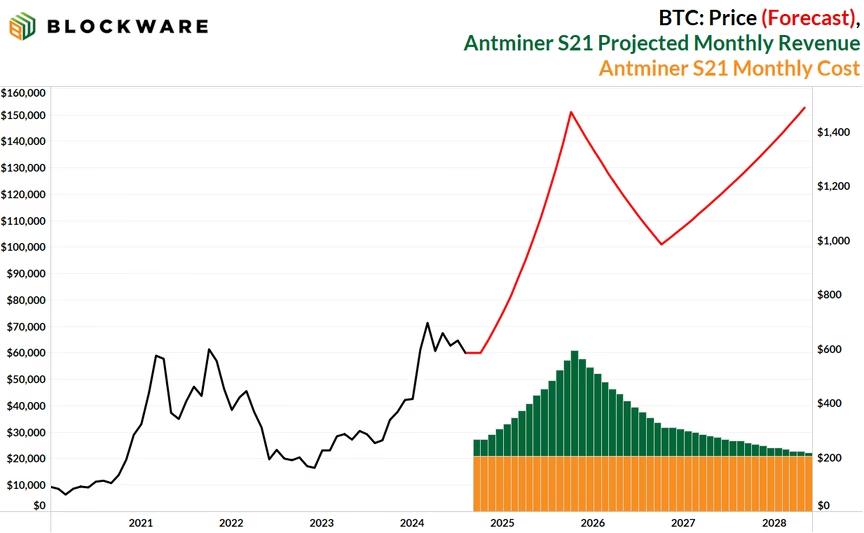
As far as price forecasts go, $150,000 this cycle is a highly conservative estimate. Even with this lowerbound forecast the economics for Bitcoin mining becomes highly profitable during the bull market. In this scenario, Hashprice reaches $0.096 at its peak and a single S21 profits ~$6,500 over the course of the epoch.
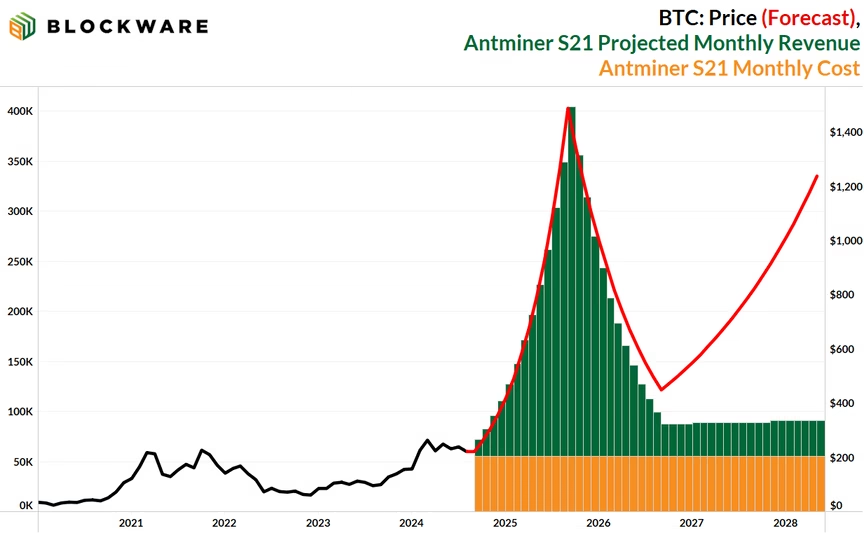
This case supposes a $400,000 BTC cycle top in late 2025 – in accordance with one of our previous research reports. A higher BTC price will result in more investments made into BTC mining, so we increased our hashrate projection accordingly. This projection results in a peak Hashprice of ~$0.24 and cummulative profits of ~$15,300 for a single Antminer S21.
Let’s compare mining Bitcoin with buying spot Bitcoin. This model case study shows the BTC accumulation of an Antminer S21 throughout the coming cycle using the following assumptions/inputs:
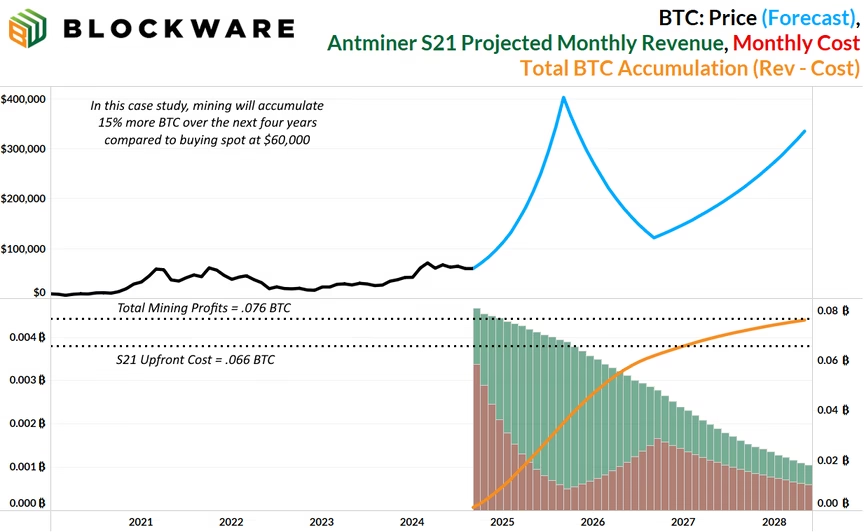
In this scenario, mining outperforms buying spot Bitcoin by 15%!
Opportunity Cost of Buying ASIC: ~0.066 BTC BTC Accumulated via Mining: ~.076 BTC
Unaccounted for here is the aforementioned resale value of the S21. Assuming the price of the ASIC is roughly correlated to the price of BTC, as was the case with the S19 in the previous cycle, the outperformance of mining compared to spot will be even greater than 15%.

Here we examined the dynamic relationship between Bitcoin’s price and network hashrate. Unlike holding Bitcoin, where “time in the market” is more important than “timing the market, ” entering the mining market at the right moment is crucial for success.
Historically, the Bitcoin network has experienced diminishing returns in both price and hashrate growth with each cycle. However, the decline in hashrate growth is notably steeper, presenting unique opportunities for miners. Moreover, as Bitcoin’s price surges, hashrate lags behind due to the time-intensive nature of deploying physical infrastructure and energy resources necessary for mining. This lag creates windows where mining revenue can skyrocket, particularly in the 12 to 18 months following a halving event.
To stay ahead in this competitive industry, it’s vital for miners to align capital deployment around the 4- year halving cycles. Understanding these dynamics and acting accordingly positions miners to experience maximum benefit during Bitcoin bull markets – and minimize downside risk during bear markets.
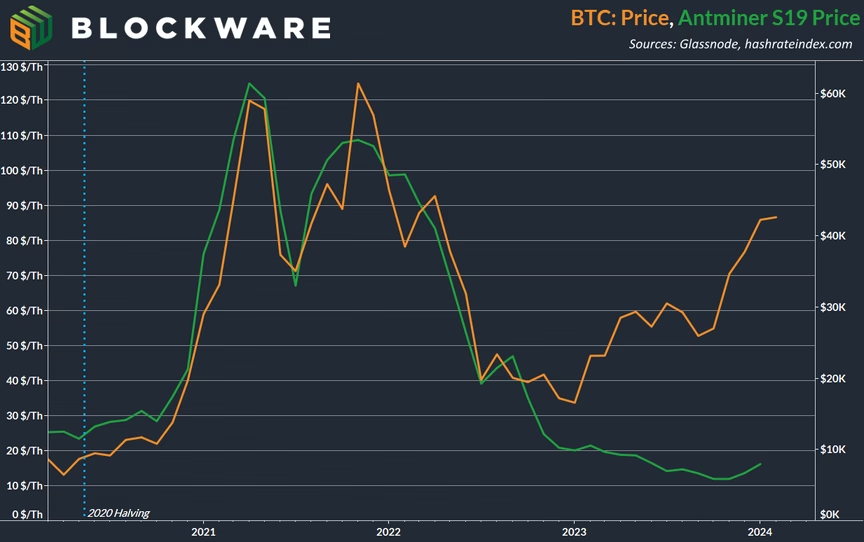
Windows of explosive mining profit margins have historically resulted in equally as bullish price action for Bitcoin mining hardware (ASICs). During the 2021 cycle, the price of an Antminer S19 rose more than 600% to ~$120/Th. Antminer S21’s are poised to see a similar increase in price during this cycle.