Humanity is naturally converging on a global Bitcoin Standard due to BTC having unrivaled monetary properties. This Blockware Intelligence Research Report forecasts the future purchasing power of BTC as it becomes the dominant store of value through the demonetization of other asset classes.
Humanity is naturally converging on a global Bitcoin Standard due to BTC having unrivaled monetary properties. This Blockware Intelligence Research Report forecasts the future purchasing power of BTC as it becomes the dominant store of value through the demonetization of other asset classes.

Due to the failure of fiat to maintain its value over time, humans are forced to use non-monetary goods as tools for savings. The nominal market value of assets is comprised of their utility value, the value derived from direct consumption of the good, plus a monetary (savings) premium, value attributed to use of the good as a store of value. Under a global Bitcoin Standard, with BTC serving as a savings mechanism free from counterparty risk and debasement via inflation, humans will no longer be forced to use risk assets as savings vehicles; thus the monetary premium will be greatly reduced. Assets will be priced on their utility, and the function of supply and demand. During the transition to a Bitcoin Standard, BTC will absorb the monetary premium of other asset classes.
Despite already having widespread notoriety, BTC is still in its infancy as a store of value. When juxtaposed with other assets the market cap of BTC is fairly high, ranking 14th against public companies and precious metals, but BTC is more than just a unique asset. BTC is a unique asset class and, as such, it should be compared to the market caps of other asset classes.
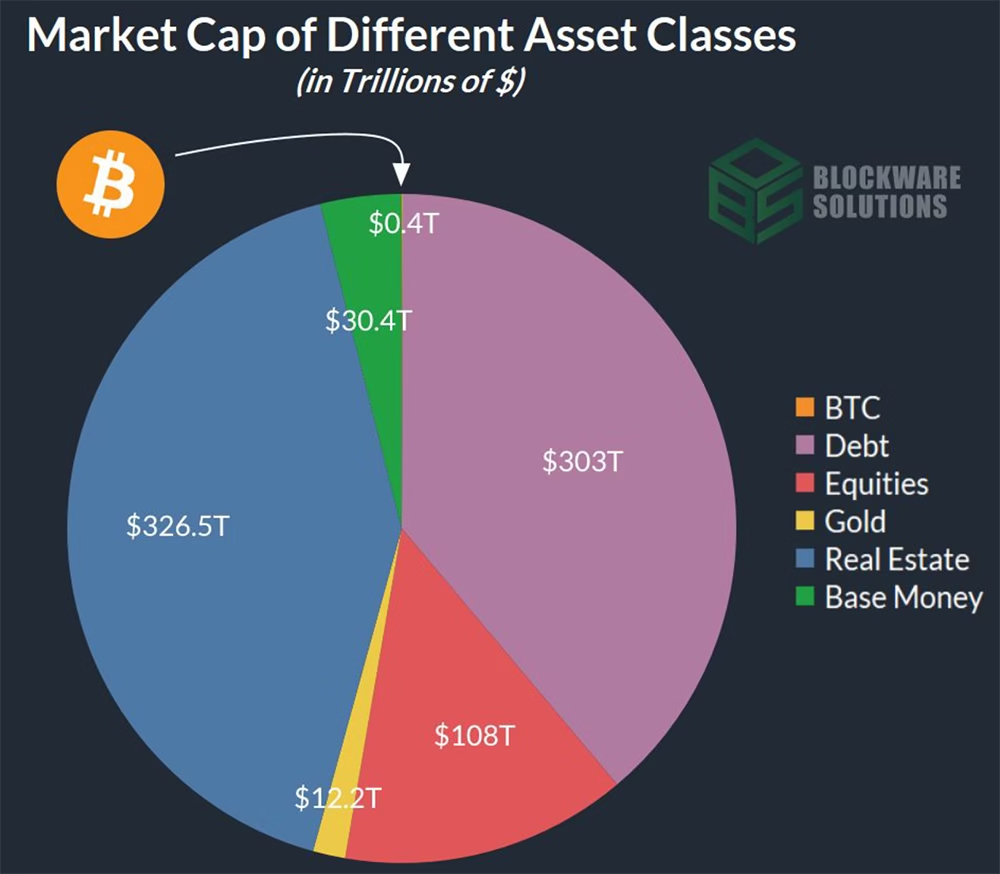
We have estimated the total global value of financial assets to be roughly ~$780 Trillion. This calculation consists of the market cap of BTC plus the market caps of total global debt, equities, real estate, and gold. Of the ~$780T in global financial assets, BTC currently represents ~0.05%.
In order to conceptualize the future purchasing power of BTC, we must use fiat as the unit of account for this forecast. As the world transitions from a fiat standard to a Bitcoin standard, the former will continue to debase and the values in the model will likely be vastly underestimated in nominal terms. The values forecasted in this model are represented in real terms with 2021 dollars as the unit of account.
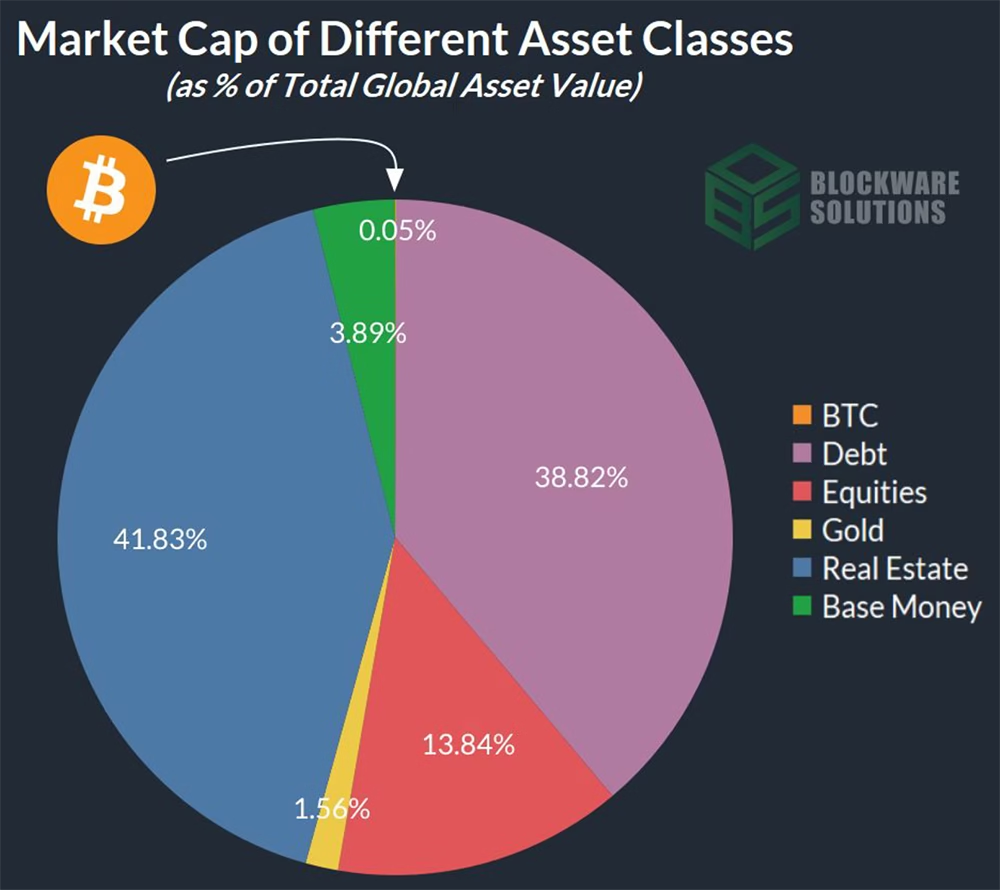
During the transition to a global Bitcoin standard, the supply of dollars is likely to continue growing exponentially. Thus it is helpful to view the breakdown of asset classes by percentage rather than just nominal values.
In order to determine the future value of BTC, we must estimate the monetary premium of each asset class. Given our assumption that BTC will absorb the monetary premiums of other assets, we can determine the future value of BTC in terms of 2021 dollars by subtracting the monetary premiums from their respective market caps and adding it to the market cap of BTC.
The degree to which each of these asset classes contains a monetary premium varies. Other precious metals such as silver and copper are excluded as they have already been demonetized by gold.
The order in which we present the demonitizations is not a chronological prediction; they are presented in order of the smallest addressable market cap to the largest addressable market cap. The demonetization of these asset classes will likely occur simultaneously over a long period of time.
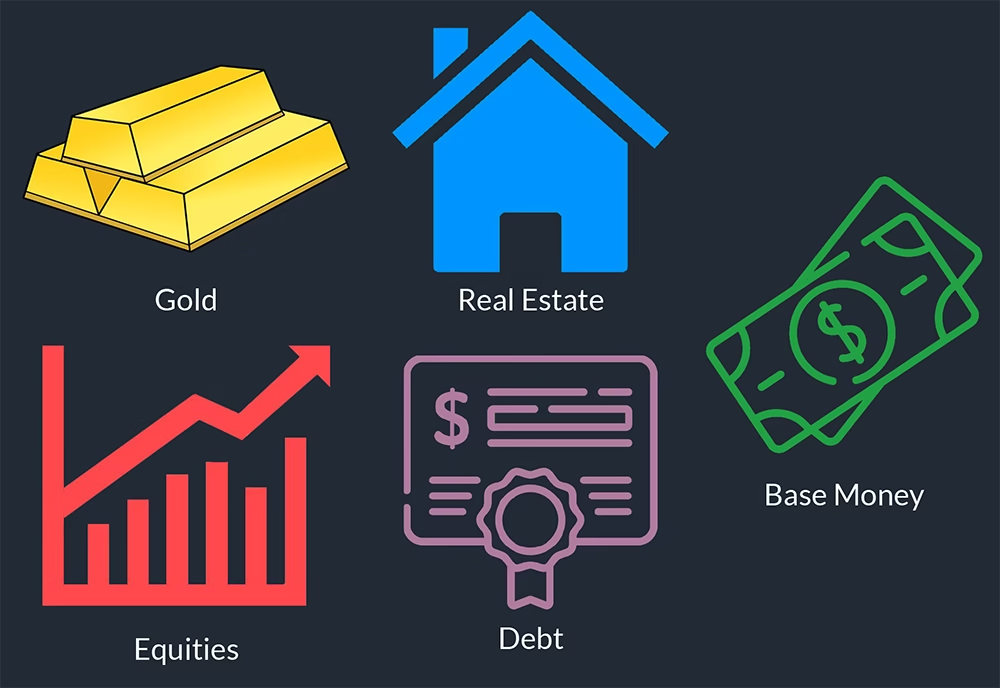
Gold, Real Estate, Equities, Debt, and Base Money will all be demonetized during the transition to a Bitcoin standard. With these asset classes no longer used as a tool for saving wealth, their value will be derived solely from their utility.
Gold finished 2021 with an estimated market cap of ~$12 Trillion.
Sources estimate that 47% of gold’s market cap is comprised of jewelry. The remaining 53% (~$6.4T) is bars, coins, ETFs, and other financial holdings.
Adding the 53% monetary premium to BTC’s market cap brings the market cap of gold down to ~$5.7T and the market cap of BTC up to ~$6.9T.
There is a valid argument that the jewelry sector of gold’s market cap will be demonetized as well. A large and unknown percentage of gold’s utility value as jewelry is likely derived from the “clout” factor due to the association of gold with wealth. Gold as a signal of wealth and power would be in jeopardy should Bitcoin usurp it in market cap. In turn, the demand for and price of gold jewelry would be negatively affected. This point is worth noting, however, to remain conservative in our forecast, we will not be factoring in this possibility.
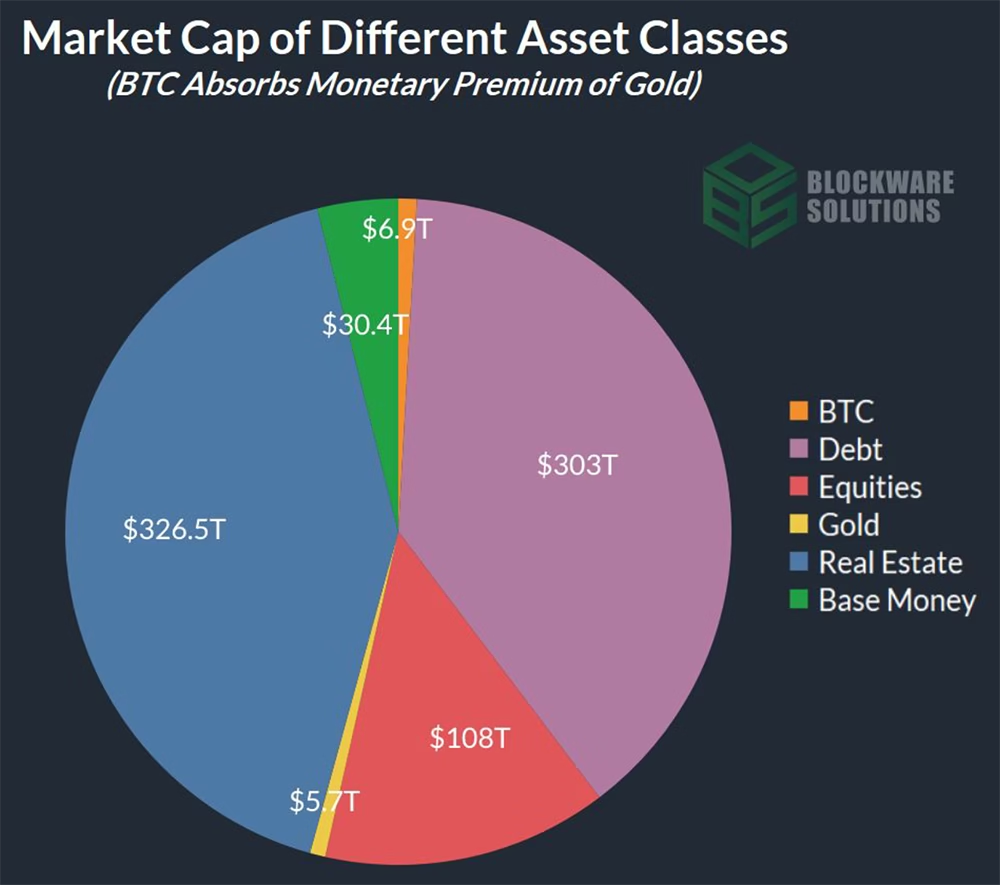
After absorbing the monetary premium of gold, the BTC market cap will be nearly $7 Trillion and the price of BTC will be ~$327K.
The thesis of this report is predicated on a future in which BTC replaces fiat currency as the global monetary standard. As such it is appropriate to allocate the market cap of base fiat money to the market cap of BTC. Afterall, the value of money is 100% predicated on a monetary premium; it has no utility value as it cannot be consumed.
The base money of all fiat currencies have a combined market cap of ~$30.4 Trillion USD. Adding that to BTC’s market cap, including the previous addition of gold’s monetary premium, brings it up to ~$37.3 Trillion.
The monetary premium of other asset classes being substantially greater than the monetary premium of the base money is a symptom of fiat’s failure to be a reliable store of value. If today’s base money was good at being a store of value, all of the monetary premium in other assets would be in the base money.
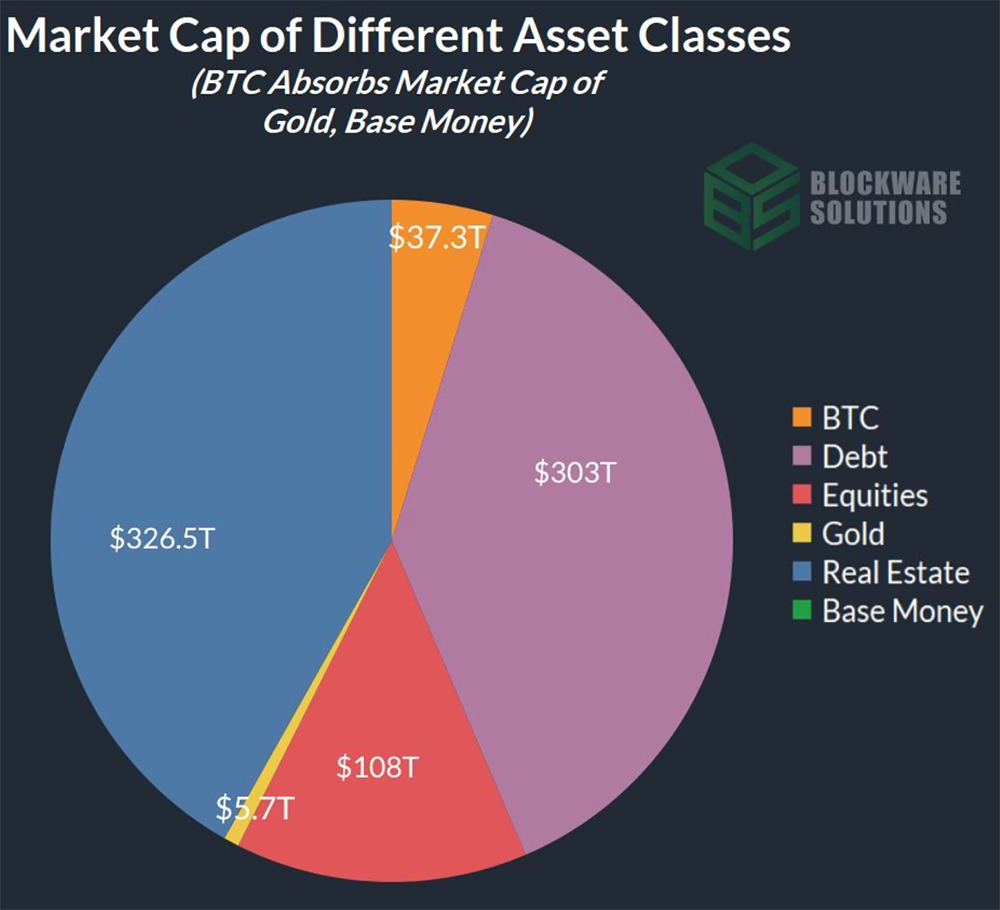
After absorbing the monetary premium of gold and base money, the BTC market cap will be ~$37.3 Trillion and the price of BTC will be ~$1,774,697.
Over time, through innovation and technological advancements, the aggregate productivity of humanity increases. In other words, the output of goods and services in the economy increases at a faster rate than the inputs of labor and capital. Humans are able to produce more value and increase the overall standard of living.
Under a monetary system that is not plagued by indefinite monetary expansion the driving force behind increasing equity values would be increasing productivity. However, in the present fiat system, the dominant factor in increasing the nominal value of equities over time is the perpetual depreciation of fiat currencies. Any increase in the nominal value of equities greater than the increase in productivity can be categorized as monetary premium:
We have data on equity and productivity growth. So all we need to do is apply the associative property then divide by total equity growth and now we have a formula for determining the percentage of equity value that is monetary premium


The expansion of the money supply is the driving force behind increasing equity values. The year 2020 is a great example of the monetary premium bestowed upon equities. Despite being a year of negative GDP growth, equity values soared as central banks aggressively flooded the market with monetary base and credit.
From 1961 to 2021, the S&P had a Compounded Annual Growth Rate (CAGR) of 7.16%. During this same period, US GDP had a CAGR of 2.96%.
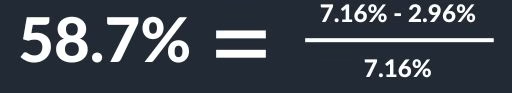
We can now subtract the 58.7% monetary premium from the total market cap of all equities and add it to the BTC market cap.

On a yearly basis the S&P 500 Index tends to move directionally alongside GDP Growth; albeit in a more volatile fashion. However, over the long run the S&P 500 Index has increased much more on a percentage basis than productivity has. This is due to the monetary premium applied to equities.
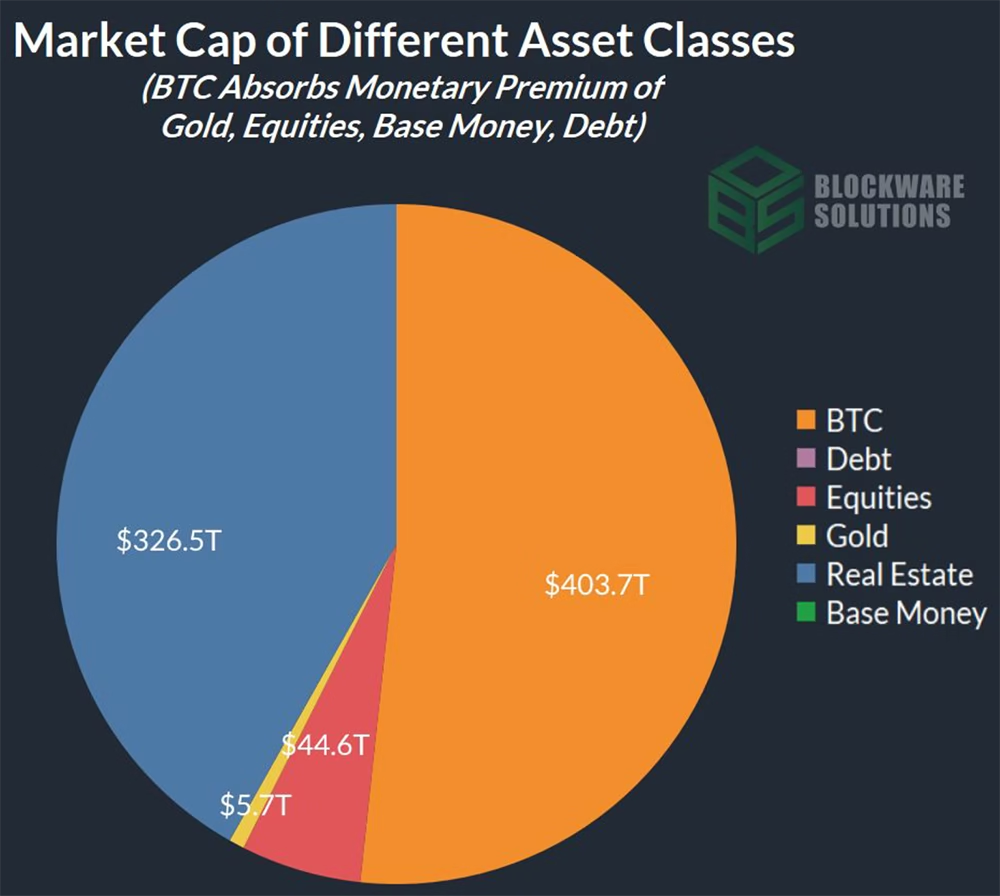
Reallocating the 58.7% monetary premium of equities (~$63.4T) to BTC, including the previously added monetary premiums of gold and base money, brings the market cap of BTC up to ~$100.7 Trillion. The equity market cap has now fallen to ~$44.6 Trillion.

After absorbing the monetary premium of gold, base money, and equities, the BTC market cap will be ~$100.7 Trillion and the price of BTC will be ~$4,793,554.
Bonds, Treasuries, Fixed Income, Fiat Contracts, etc.; this asset has many monikers. We will refer to it as debt. The fiat monetary system is built upon the shaky foundation that the promise of money (debt) is as good as actual money. The debasement of fiat creates an incentive structure such that, most of the time, the most profitable financial move is taking on as much debt as possible.
Debt, as with base money, has zero utility value. It is 100% monetary premium. We will allocate the ~$373T market cap of global debt to the market cap of BTC. That brings the market cap of BTC to ~$403.7 Trillion.
Under a Bitcoin standard, debt will be very different and the quantity of it relative to the monetary base will pale in comparison to the current monetary system. Once it is the global reserve asset, BTC will increase in purchasing power alongside global productivity (see slide 20 for more on this). As such, debt will be far less necessary as the real yield generated from saving BTC will be the new “risk-free rate.” Debt on a Bitcoin standard will likely take the form of short-term (less than 5 years) loans. The 30-year mortgage will most likely be extinct. Nevertheless, it is not our intent speculate on the role of debt in a hyper-bitcoinized economy. Rather, we are presenting the idea that debt in its present, fiat-denominated form, will be absorbed by Bitcoin.
After absorbing the monetary premium of gold, base money, equities, and debt, the BTC market cap will be ~$403.7 Trillion and the price of BTC will be ~$19,222,126.
Michael Saylor describes increasing prices with the expression “inflation is a vector.” The price of different goods and services increase at different rates when the underlying currency is devalued. Goods that are difficult to produce and highly desirable tend to have the greatest price increases as a consequence of monetary debasement. This is why certain goods have a more sensitive response to monetary expansion than other goods. Kraft mac n’ cheese is inexpensive to produce and not in high demand; thus its price is minimally inflationary. Buildings are difficult to produce as they require the inputs of many different raw materials; lumber, steel, labor, time, etc.; Moreover, they are in constant demand due to their high utility value. For this reason housing is very reactive to monetary expansion.
While there has not yet been a year in which M2 had a negative growth rate, you can observe that during the time periods in which the M2 growth rate slowed down, the housing market reciprocated with slowed or negative growth. Inversely, periods of high growth in M2 corresponds with high growth in housing prices.
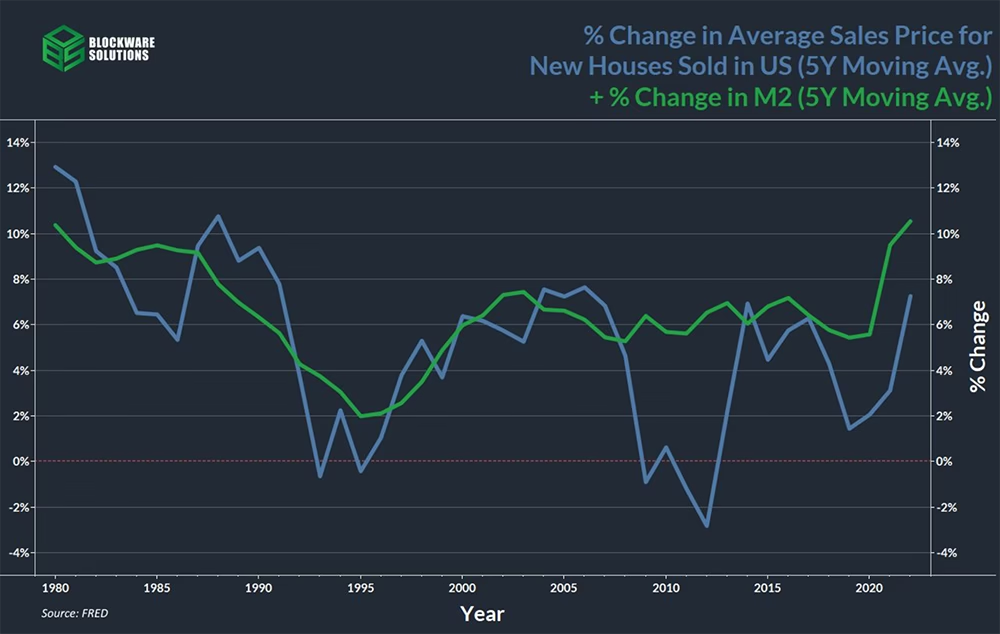
Similarly to the aforementioned equities, the foremast factor of increasing real estate prices over time has been the expansion of the money supply.
To determine the monetary premium of real estate we will be comparing the cost of construction overtime with the sales price of new houses overtime.
The reasons these metrics provide the best calculation for the monetary premium of real estate are as follows. First, the debasement of fiat currency increases the nominal cost of raw materials used to build houses. As such, not all of the increase in the sales price of new houses can be attributed to an increasing monetary premium; the increasing nominal cost of construction is a major contributing factor. Second, by looking at new houses specifically, we eliminate the physical depreciation occurring in used houses that acts as a deflationary force on their real price. The only deflationary force on the sales price of new houses is increasing productivity.
Observing changes in the price of undeveloped land could be a valid way to determine the monetary premium of real estate. However, this is a less viable option than our method because A.) data on this is scarce and incomplete and B.) determining the monetary premium requires comparing the rate of change for a productivity metric and a price metric. Looking at the rate of change for a single metric does not give any insight regarding monetary premium.

The sales price of housing increases over time due to monetary expansion. However, some of amount of the total increase in sales price can be attributed to price increases of the raw materials used in construction.
We can calculate the monetary premium of real estate in a similar fashion to our calculation for the monetary premium of equities; in which we compared the growth rate of stock prices with the growth rate of productivity. Here, we are comparing the growth rate of the sales price of new houses with the growth rate of construction costs. Under a sound monetary standard we would expect the change in the price of new houses to move congruently with the change in the cost of construction. This is not the case under the fiat standard and we can contribute the difference to a monetary premium that is placed on housing.
The following formula will be used to determine real estates monetary premium:


Looking at the graph of the rates of change (5-year Moving Average applied for visual smoothing) we see that the sales price of new houses and construction costs are roughly correlated with sales price being the more volatile of the two metrics.
Note: The data available on construction costs is an annual rate of change (plotted on the previous slide with a 5-year moving average); there’s no reliable data on construction prices themselves. To juxtapose the change in construction costs vs. sales prices we have created an index such that the cost of construction is initially set to the sales price of housing in the base year, 1975, and the rates of change from the construction data set are applied from there.
As discussed previously, under a sound monetary system the cost of goods is deflationary due to increasing productivity; housing is no exception. When adjusting for M2, the price of construction has gotten tremendously cheaper over time, as has the final sales price.

When adjusting for inflation, it is important to adjust for the growth in money supply rather than CPI, which simply reflects an arbitrary basket of goods. The real cost (adjusted for M2) of constructing a house, as well as the final sales price, has gotten tremendously cheaper over time.
This chart contains the nominal values for the average sales price of new houses and the construction cost index. To determine real estate’s monetary premium, we will be calculating the Compounded Annual Growth Rate (CAGR) of both. The sales price of housing has a CAGR of ~5.55%, while construction cost has had a CAGR of ~4.27%.

That gives real estate a monetary premium of ~23.1%
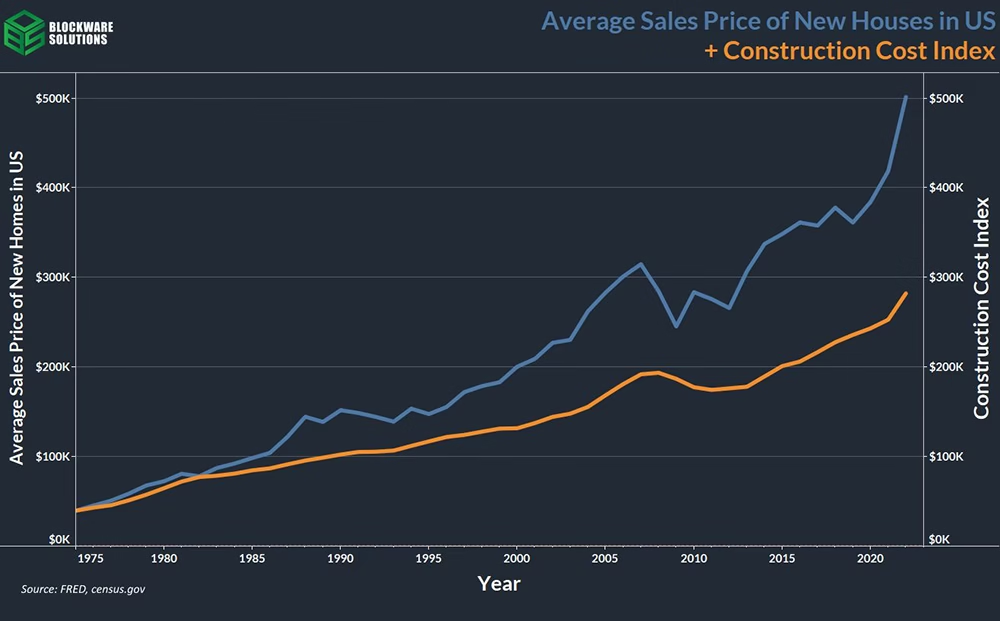
Despite the cost of constructing a house only increasing an average of 4.27% per year, the final sales price of new houses has increased an average of 5.55% per year. This ~23% difference in the rates of change represents the monetary premium of real estate.
Adding the 23.1% monetary premium to BTC brings the market cap of BTC up to ~$479.1 Trillion. The real estate market cap has now fallen to ~$251.1 Trillion

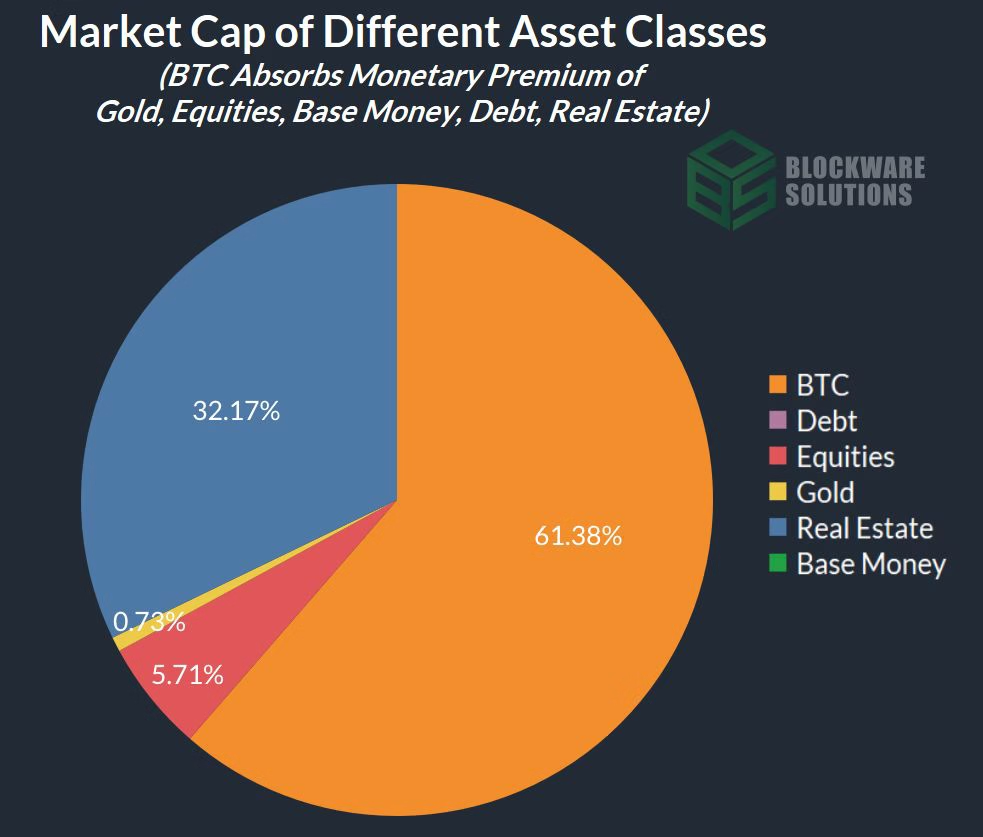
After absorbing the monetary premium of gold, base money, equities, debt, and real estate, the BTC market cap will be ~$479.1 Trillion and the price of BTC will be ~$22,814,092
After completing the demonetization of other asset classes, the purchasing power of Bitcoin will comprise of roughly 61.4% of the total global market cap of financial assets. 1 BTC will have a purchasing power equivalent to ~$22,814,092, 2021 US Dollars.
The last point to note is that the purchasing power of BTC will increase in perpetuity corresponding to productivity increases. As discussed in the equity and real estate sections, technological advancements increase economic productivity over time. As such, the real cost of goods and services, which, on a Bitcoin standard, will be measured in BTC, will decrease every year. Holders of BTC will accrue purchasing power without having to invest in risk-on assets. This appreciation in purchasing power will represent the new “risk-free rate” that is the opportunity cost and target return of all investments. Under the fiat standard the “risk-free rate” has been that of government treasuries.
Assuming an average annual global GDP growth rate of 2%, the purchasing power of BTC will double every 36 years.
This forecast does not include a timeline as it is impossible to predict exactly how long this transition may take; if it occurs at all. However, considering BTC’s superior monetary properties, its accelerating rate of adoption, and the sustained high levels of inflation among all fiat currencies, it is reasonable to assume that a transition to a global Bitcoin standard is becoming an increasingly likely outcome.
Even after demonetizing other financial assets, Bitcoin will still incentivize savings and low-time preference behavior. The increase in purchasing power obtained by simply holding Bitcoin will be the “risk free rate.”
