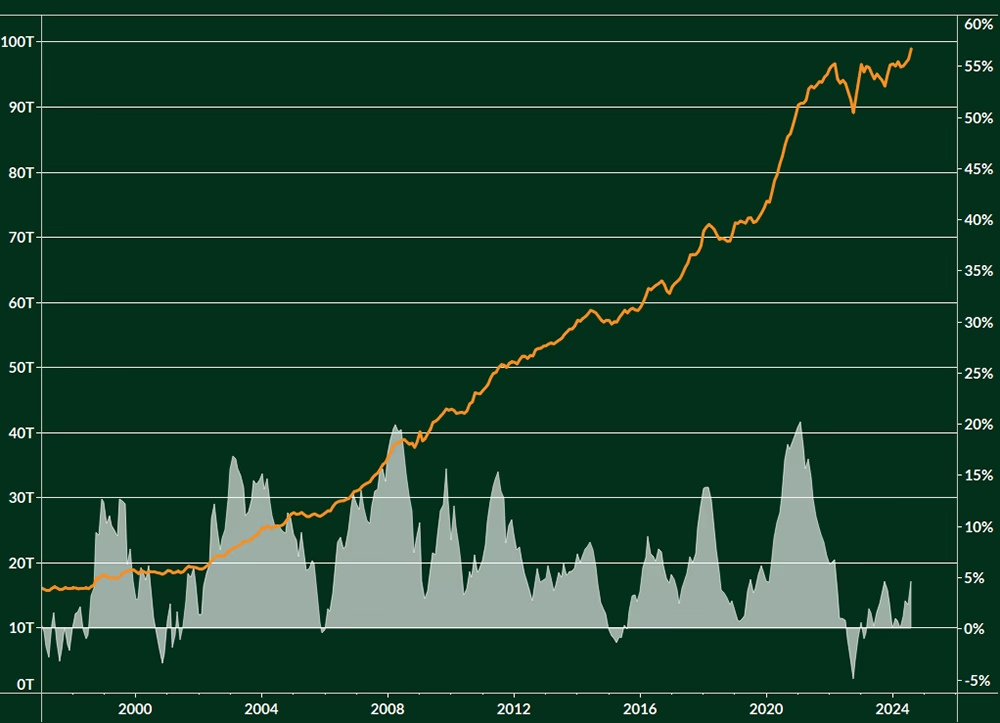
M2 for Major Fiat Currencies ( in$terms )
YoY % Change
The supply of fiat currencies has increased relentlessly for decades on end. Periods of monetary contraction are brief, minute, and often met with heightened civil unrest due to the negative effect this has on asset prices.
This chart shows the combined M2 for the US Dollar ($), Japanese Yen (JP¥), Chinese Yuan (CN¥), Euro (€), Deutsche Mark (DM), British Pound (£), and Canadian Dollar (CA$). Since 1996, the combined supply of these currencies has grown by ~6.5% per year. This is a more accurate measure of inflation than the “Consumer Price Index” (CPI)
With fiat currencies rapidly devaluing, investors need to park their capital in assets that are immune to this devaluation.
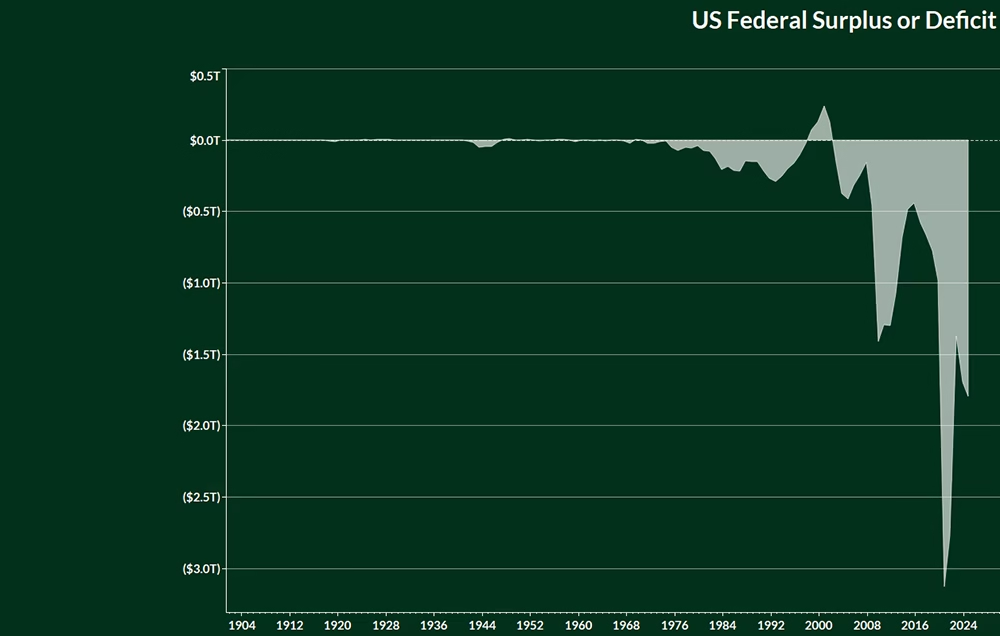
US Federal Surplus or Deficit
The primary driving force behind the increase in the supply of fiat currencies is government deficit spending.
Governments borrow money via treasury bonds – in order to service the payments of those bonds the government must:
Deficit spending has exploded in the twenty-first century — with annual deficits north of $1 trillion becoming the status-quo. The bailouts of 2008 & 2020 were major spending catalysts — another event of this magnitude is likely to take place this decade.
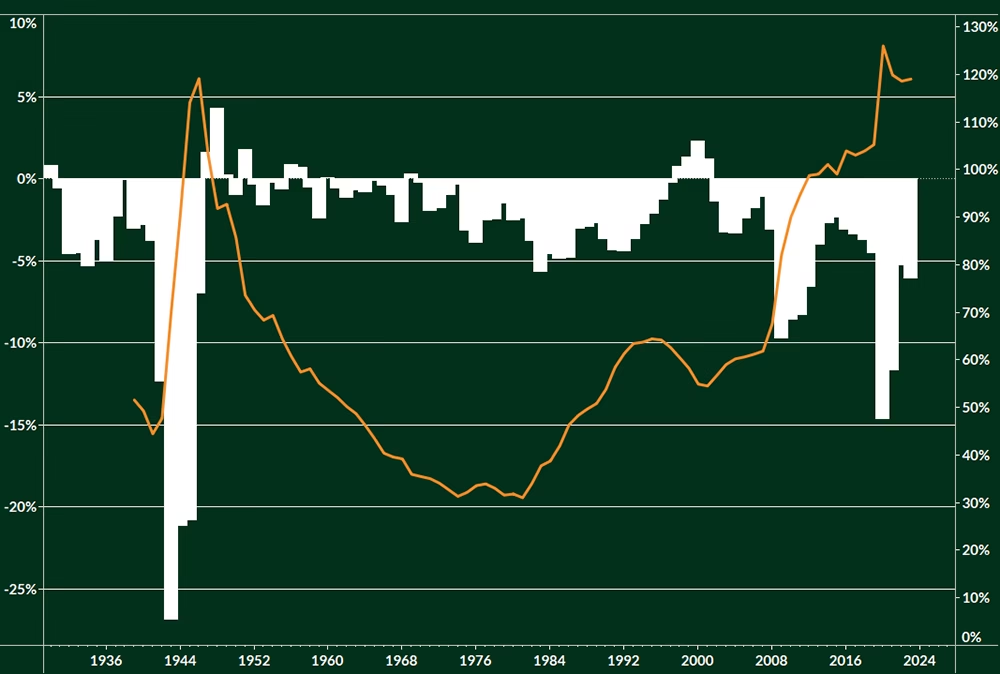
Gross Federal Debt as % of Gross Domestic Product
Federal Surplus or Deficit as % of Gross Domestic Product
The magnitude of deficit spending in recent years is illustrated by this chart which shows the deficit as a percentage of GDP. In 2020 & 2021, the deficit alone was more than 10% of GDP. The only comparable times in history are World War 2 and the 2008 Great Financial Crisis.
With future Social Security & Medicare liabilities amounting to hundreds of trillions of dollars in mandatory Government spending, the deficits will remain high for the foreseeable future.
Decades of deficit spending has accelerated the growth of the total debt, which is now ~120% of the annual GDP. This is up from ~30% in 1971 when the US Dollar lost its gold backing.
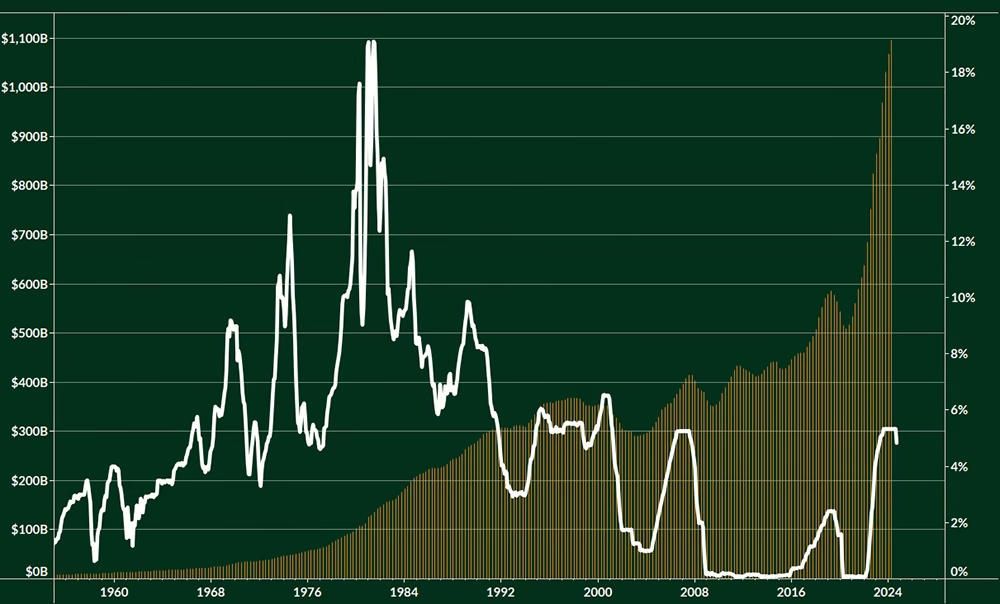
Federal Government Current Expenditures: Interest Payments
Effective Federal Funds Rate
Hawkish policy from the Federal Reserve in 2022 & 2023 sent interest rates to multi-decade highs. With the treasury being forced to borrow at higher rates, annual interest payments on the debt have surpassed $1 trillion.
Interest payments now comprise a larger portion of the Federal Budget than Military Spending.
This is clearly unsustainable and the Fed has already begun lowering interest rates. The Fed Funds futures market expects as much as 150 basis points worth of rate cuts before the end of 2025. There’s a non-zero probability that this is a underestimation — Fed policy decisions are highly contingent on labor data, which is showing signs of weakness.
BTC/USD
YoY % Change of M2 for Major Fiat Currencies
With all of this in mind, the bullish case for BTC is readily apparent.
Over the long-term, fiat liquidity must increase in order to subsidize the debt payments of large fiscal deficits. Liquidity goes through cycles of expansion and contraction and we are in midst of a transition back to expansion.
BTC is highly responsive to changes in liquidity. The bear markets of 2015, ‘18, & ’22 were aligned with periods of mild expansion or outright contraction. The bull markets of ‘17 & ‘21 align with periods of expansion. Uncoincidentally, BTC has performed well in 2023 & 2024 just as the market re-entered a regime of liquidity expansion.
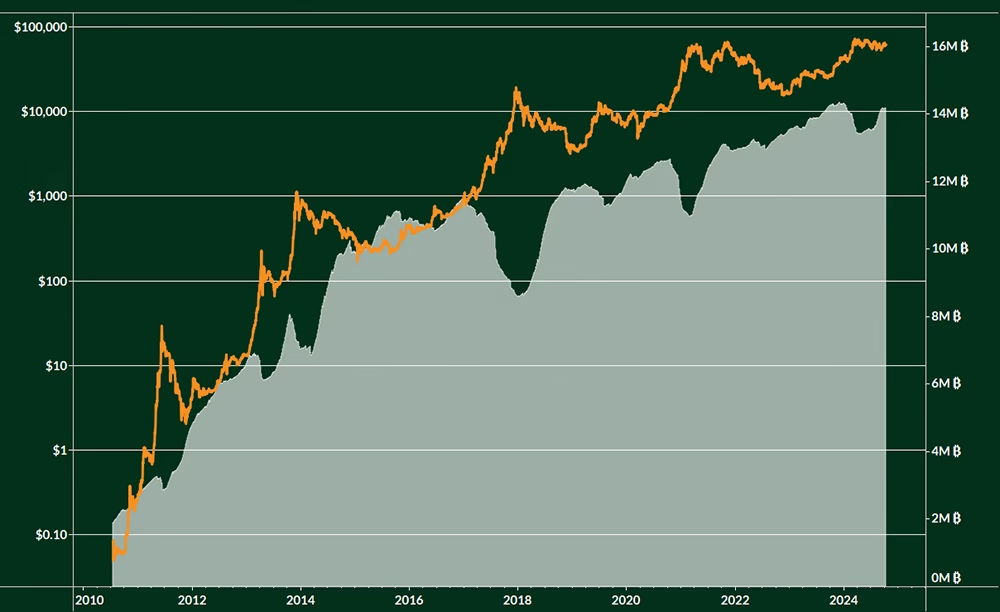
BTC/USD
Long-Term Holder Supply (last moved 155+ days ago)
Over 14 million BTC (~2/3 of the total supply) currently belong to “Long-Term Holders.” A Long-Term Holder is an address or cluster of addresses that have not sent any BTC in 155 days or longer.
This metric provides a high-level glimpse into the holding patterns of Bitcoin users. LTH Supply peaks tend to coincide with local bottoms, with the supply-side illiquidity creating a price floor. Drops in LTH-Supply take place as patient holders sell into market strength — note the dip in LTH supply in Q1 as the return to all-time highs incentivized some holders to take profits. Long-Term Holders have aggressively accumulated coins during this summer’s sideways price action.
Cyclicality aside, Long-Term Holder Supply has risen historically as new waves of individuals and businesses adopt Bitcoin as a treasury reserve asset.
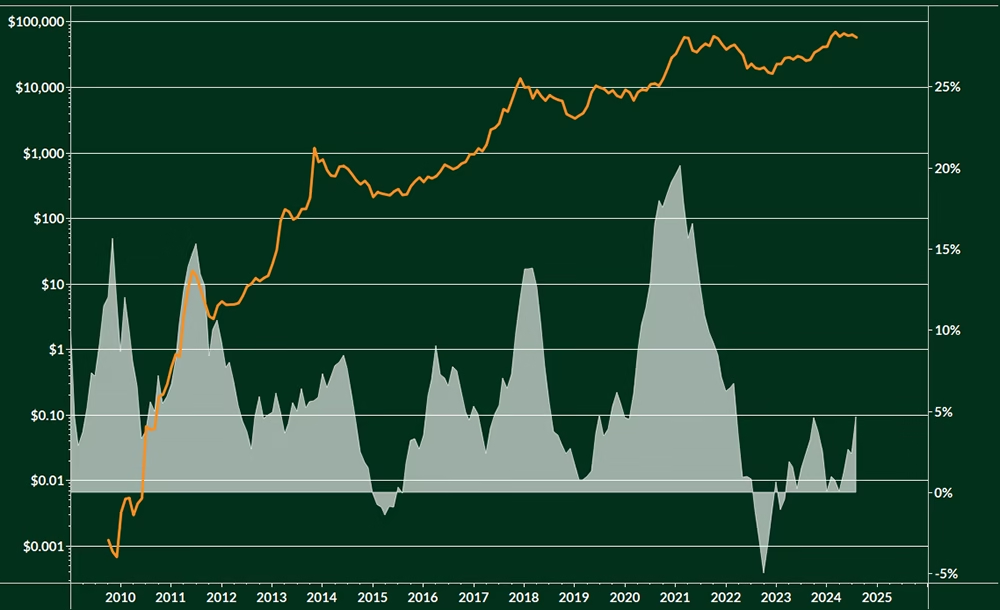
BTC/USD, Realized Price
Market Price to Realized Price Ratio
Another way to gauge potential sell-pressure is by looking at the ratio between Bitcoin’s price and “realized price.”
The realized price is the average price at which all Bitcoin’s were last moved – on chain. This is essentially a measure of the aggregate cost-basis of the market (similar to VWAP in traditional finance). The ratio between price and realized price tells you how much “unrealized gains” exist in the market. A high ratio means there’s many entities “in the money” and the likelihood of selling is high.
The current ratio is 1.9 — meaning the average Bitcoin holder is up ~90%. This is well below historical “peak bull market” values in which the average holder is up 3-5x.
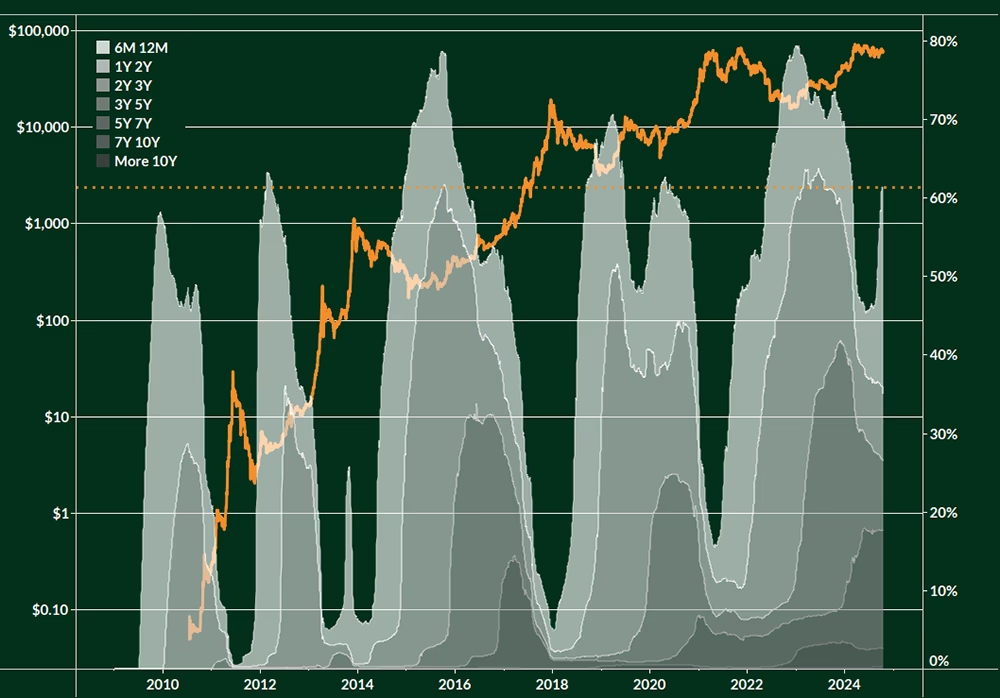
BTC/USD
“Realized Cap HODL Waves”
“Realized Cap HODL Waves” is a blend of the two previous on-chain metrics. This shows us how much of the network’s realized market cap is attributable to various cohorts of holding duration. In other words, who has the most chips on the table.
Notice the older cohorts (darker shade) comprise a smaller portion. This is because someone who last moved their BTC 10+ years ago did so at a much lower $ price. So while their BTC is valuable, in terms of the total value being stored in the network they attributed very little compared to someone buying an equivalent amount of BTC at current-day prices. Peaks in Long-Term Realized Cap HODL Waves mean that most of the value stored in the network has been done so by those who are inherently much less likely to sell their coins. Long-term holders represent more than 60% of the value in the network — which bears a strong resemblance to the onset of previous bull markets.
BTC/USD
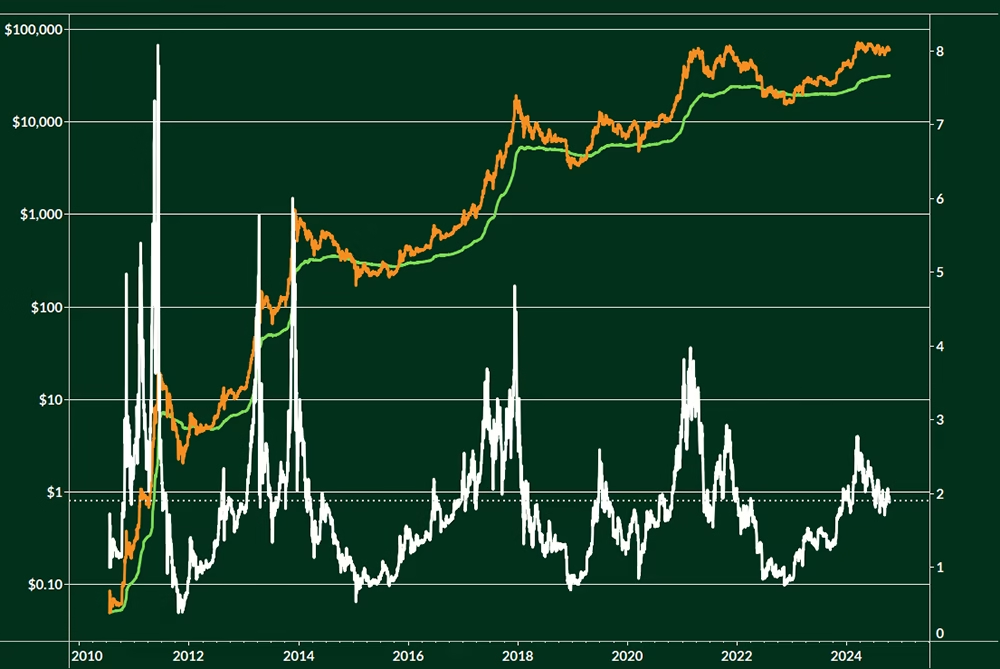
Energy Gravity, Energy Mass
Wholistically analyzing the data presented far undoubtedly paints a picture that is bullish for BTC. A BTC bull market in 2025 would have an immense positive impact on Bitcoin miners.
“Energy Mass” (green line) measures the cost to mine 1 BTC if you are using an average machine with an average electricity rate. “Energy Gravity” (orange line) measures how much revenue an average Bitcoin miner earns per unit of energy (kilowatt hour). Previous run-ups in the BTC price resulted in an exponential increase in Energy Gravity (chart axis is log scale).
Even with the halvings slashing mining revenue every four years, miners that upgrade hardware with the halving are able to reap the benefits of BTC bull markets.
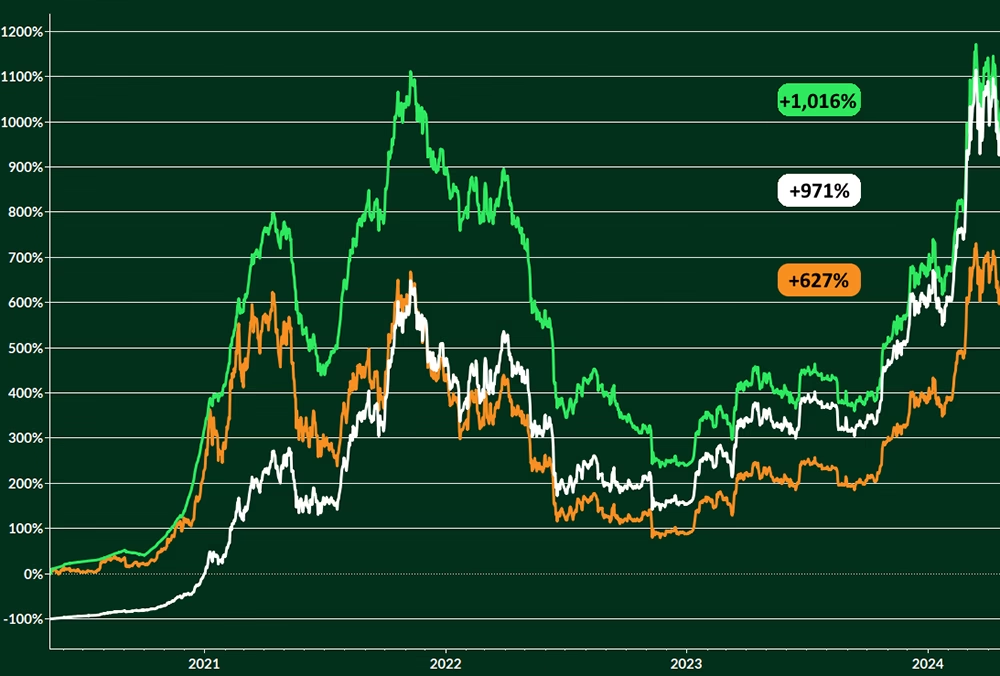
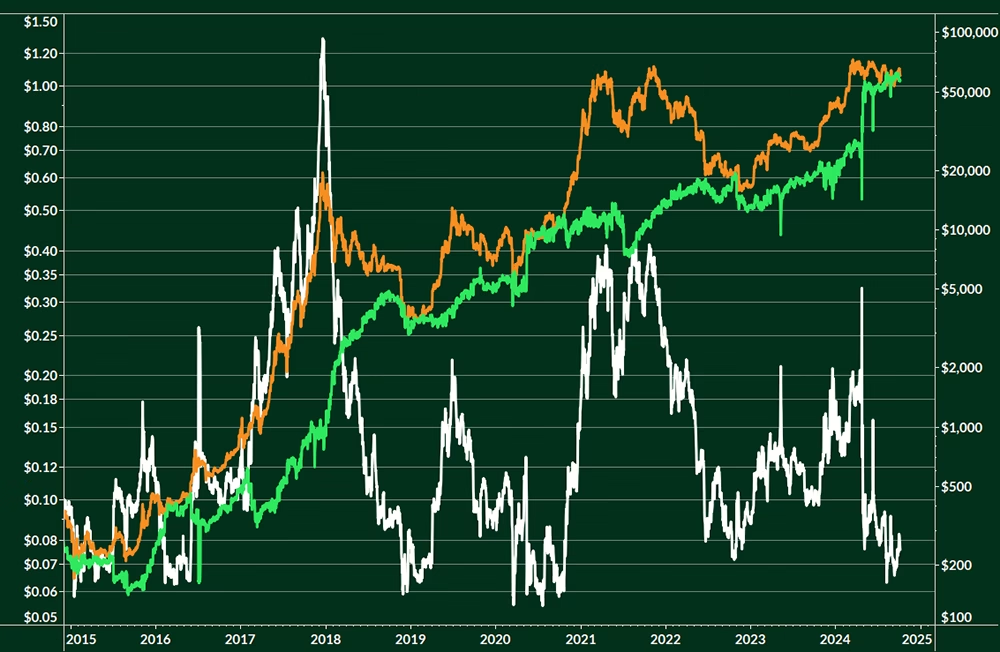
Spot BTC returns (6.25 Halving Epoch)
Mining Returns, Mining Returns Including ASIC Resale Value
Strategically deploying capital into Bitcoin mining at the start of a new halving epoch has historically lead to mining outperforming spot BTC itself. The chart here analyzes the performance of an Antminer S19 during the 2020 to 2024 halving cycle (the most efficiecnt ASIC at the time of the 2020 halving).
An S19 purchased at the 2020 halving cost ~$2,200. This machine mining with a rate of $0.078/kWh, outperformed an equivalent purchase of spot BTC 971% to 627%.
The green line measures the performance inclusive of the resale value of the S19 — in which case the total returns eclipsed 1,000%.
For a more detailed analysis on the performance of Mining vs spot BTC,

Rolling 4-Year Sharpe Ratio (Risk-Adjusted Returns)
Bitcoin, Gold, S&P 500, Bonds ($TLT)
Bitcoin’s day-to-day volatility is often referenced by skeptics. While double-digit day-to-day price swings can be intimidating, even on a risk-adjusted basis BTC has superior returns to all other major asset classes.
The Rolling 4-Year Sharpe Ratio for BTC has been higher than that of Gold, The S&P 500, and Long – Duration Treasury Bonds for nearly all of Bitcoin’s existence. So regardless of which 4-Year window you pick, BTC has had superior returns than these other assets even when adjusting for its volatility.
That being said — mining is a great way to minimize your exposure to downward BTC volatility. Even during price drops, miners with the most efficient ASICs are almost always cash-flow positive — producing BTC for less than the market price. Moreover, the price of mining hardware does not experience the same rapid price movements that Bitcoin does. Changes in ASIC prices typically occur only after sustained moves in the BTC price — either up or down.

Blockware enables anybody to start mining Bitcoin.
With our owned and operated data centers across the United States, we provide our clients access to low cost power and allow them to mine without having to deal with the heat and noise of mining at home.
Contact us to purchase the latest-generation Bitcoin mining rigs with zero lead time and start mining Bitcoin today!