
Bitcoin is Certainty in an Uncertain World
Abstract
This Blockware Intelligence Research Report contrasts the certainty provided by Bitcoin’s immutable scarcity with the macroeconomic uncertainty associated with record-high inflation.
We examine the historical impact of high inflation on the performance of various traditional asset classes including commodities, fixed income, & equity markets. In doing so, we will illustrate the similarities and superiorities of Bitcoin compared to every other asset class in this unrestrained inflationary environment to make it clear that Bitcoin is not simply a commodity, but a disruptive network technology and the ultimate savings vehicle.
Key Points
Bitcoin is highly resistant to any changes that could alter its value proposition of being a perfectly scarce, portable, durable, divisible, and fungible savings technology.
Macroeconomic uncertainty is creating turmoil across asset classes. Inflation recently hit a 40-year high after unprecedented monetary stimulus, the Federal Reserve is in the process of raising interest rates, oil is appreciating to historically significant levels, consumer confidence is eroding, and Russia has invaded Ukraine.
The fixed income market is beginning to signal that investors expect the Federal Reserve to increase interest rates in the short term too much (to fight inflation) that it ends up squeezing credit, causing a recession and ultimately leading to lower interest rates in the future.
Commodities have fared well in historical inflationary periods, and Bitcoin is a new super commodity due to its unique immutable scarcity.
In an uncertain excessive inflationary macroeconomic environment, accumulating Bitcoin is an attractive capital allocation strategy that investors should be utilizing as superior savings technology.
New Disruptive Technology: Immutable Scarcity
Bitcoin is different from all other assets (crypto and traditional) due to its unique property of immutable scarcity. Unlike other commodities, Bitcoin has a predetermined algorithmic supply schedule that cannot be changed. No matter how many miners join the network, there will never be more than 21,000,000 BTC.

This chart displays the projected supply growth of Gold and USD compared to BTC. It normalizes all assets in BTC terms starting in 2020. BTC future supply is modeled using immutable future block subsidy halving events. Gold future supply is estimated to grow at 2.5% annually. USD (M2) is estimated to grow at 7.5% annually.
The 2015 - 2017 Bitcoin Blocksize War revealed just how immutable the Bitcoin protocol really is. With a large number of exchanges and miners supporting a Bitcoin hard fork that would have changed key consensus rules (block size), Bitcoin users (node operators) were able to resist consensus-altering changes and upgrade the network in a backward-compatible way.
This battle set the precedent that Bitcoin is highly resistant to any changes that could alter its value proposition of being perfectly scarce, portable, durable, divisible, and fungible. Bitcoin is a Schelling point on a set of rules with no rulers. These immutable properties make Bitcoin even more attractive during times of macroeconomic uncertainty and rampant inflation.
Macroeconomic Uncertainty in a Raging Inflationary Environment
The current macro-environment is best described as complex with signs of trouble ahead: inflation continues to hit or exceed 40+ year highs, the Federal Reserve is in the process of raising interest rates, oil is trading above the historically important level of $100, consumer confidence is eroding, Russia has invaded Ukraine, and the yield curve is inverting.
With the complexity arising, investors are evaluating different capital allocation strategies during these uncertain times. This report will explain how the immutable properties of Bitcoin make it similar, yet superior to different asset classes in this environment.

Investors and the public alike need a monetary tool to specialize, trade, save, and invest. Since the dawn of civilization, individuals have converged on specific tools with specific properties to be used as money. Economic systems typically converge on one single form of money, which is at present, the US dollar. However, Blockware Intelligence argues that Bitcoin is the best form of money due to it having the most credible, perfectly scarce monetary issuance schedule and the most immutable consensus rules. There is no second best when it comes to money. This has become abundantly clear as trillions of US dollars continue to be added to the money supply, driving inflation to historic highs.

Flow Chart Source: https://unchained.com/blog/bitcoin-obsoletes-all-other-money/
Monetary Supply Growth and High Inflation
When the economic cycle changes and lower and middle-class individuals begin to feel the pinch of increasing prices, it is very easy for political and central bank leaders to place the blame on external factors instead of accepting responsibility. While inflation is not entirely anyone's fault, acting as if it stems solely from geopolitical events and has nothing to do with historically low interest rates, soaring monetary supply growth, and record-high government deficits is irresponsible. This messaging complicates the narrative and delays its cure. Things are getting more “expensive” because your Dollars are becoming “weaker” due to the massive increase in the supply of Dollars.

The chart above shows the M2 money supply (denoted in billions) of the United States which counts all money held in checking accounts, savings deposits, and money market funds. M2 has exploded in the last two years. It has expanded by about 26.5% since January of 2020. This annualized growth of roughly 13.3% is nearly double the historical average of 7.2%, but this chart of M2 alone doesn’t do justice to the massive level of monetary supply expansion undertaken by the Fed.

Above is a quarterly plot of the year-over-year growth rate of the United States’ M2 money supply. The yearly growth rate in Q1 2021 was 25.67% according to the St. Louis Fed. This was significantly greater than the rate M2 expanded in the 1940s to pay for the second World War. Q1 2021’s M2 growth rate was more than double than it was during the stagflation of the 1970s and nearly triple what it was during the 2008 housing crisis.
Bitcoin’s new supply issuance, by contrast, continues to be Halved every 4 years, as expected, with the most recent Halving taking place in May 2020.

The US M2 chart provides a visual of the extreme level at which purchasing power has been drained from the hands of Americans. When the amount of money in an economy expands while the amount of goods in the economy remains relatively stagnant, it is no surprise that those goods become more expensive. This deterioration of purchasing power, largely stemming from the passing of trillions in stimulus packages, is enough to bring CPI to 40-year highs.
On April 12th, the CPI came in at an elevated 8.5% annual increase. Prices in the Consumer Price Index have not risen this fast since 1981, over 40 years ago.

Data Source: Bloomberg
Even more concerning is the level of inflation being seen by producers. Below we can see the Producer Price Index (PPI) over the last 40 years. PPI is currently at 15.2%, and the only time it has ever been higher was for two quarters in 1974.

Data Source: Bloomberg
Input and raw material prices tend to rise first until producer margins are so compressed that they are forced to raise prices for consumers. This is why PPI is a leading indicator for CPI. With PPI at 15.2%, we will likely see even higher CPI numbers to come.
Rising Interest Rates
While inflation is setting record highs, the Federal Reserve is being pressured to raise interest rates in order to slow the economy and attempt to rein in inflation. Federal Reserve officials are forecasting the federal funds rate to reach nearly 300 bps (3.00%) by the end of 2023. After the most recent adjustment, the current target federal funds rate is only 25 bps (0.25%).

Data Source: Bloomberg
Another reason as to why we’ve seen such high inflation comes from the fact that the fed funds rate has been near 0 since the pandemic started, as you can see above. Progressively lower interest rates since the early 1980s have enabled consumers, corporations, and governments to borrow more and more. Over the long run, this creates a highly fragile financial system as many individuals and corporations are in a large amount of debt and any sudden changes in their income or interest rates can put significant stress on their financial solvency.
Massive Government Deficits

Data Source: USASpending.gov https://datalab.usaspending.gov/americas-finance-guide/deficit/trends/
Not only are monetary supply metrics from the Federal Reserve clearly highlighting growth rates that are significantly higher than normal, but US federal government spending has simultaneously exploded in relation to tax revenue. The US government has not run a budget surplus since 2001, while 2008 and 2020 were both years marked by historic increases in government spending.
Skyrocketing Oil Prices
The appreciation of oil prices stemming from the Russian invasion of Ukraine only added fuel to the inflationary fire. The price of oil is rising in line with Russia's sanctions cutting off a sizable portion of the world’s oil supply. In turn, oil (energy) is an input cost to virtually all other goods and services. Higher energy prices get passed down the supply chain onto other businesses and consumers through higher fuel and heating charges.

Data Source: Bloomberg
Above you can see the relationship between CPI (white) and the price of WTI crude oil (red). When oil prices rise, the cost of transporting and manufacturing goods rises. This only exacerbates the ongoing supply chain issues.
Historically, spiking oil prices have foreshadowed US recessions. The chart below, created by Pictet Asset Management, highlights the oil price percentage deviation from the trend. In summary, their analysis concludes that there is a significant correlation between sudden spikes in the price of oil and an upcoming recession. This correlation is logical as sharp increases in commodity prices force consumers to immediately reduce both spending and investing.

Data Source: Bloomberg, Refinitiv Datastream, Pictet Asset Management https://www.bloomberg.com/news/articles/2022-03-04/history-suggests-oil-shock-raises-probability-of-u-s-recession
Eroding Consumer Confidence
Amidst such massive uncertainty, consumer confidence continues to take a hit. The metric, calculated by the University of Michigan, currently sits below the local low in March 2020, and it is approaching a level not seen since the 2008 financial crisis.
Throughout the previous decades, consumers benefited from low-interest rates and easy money. Over time they became more comfortable with this artificially manipulated economic environment. Our economic society is now beginning to pay the price of being able to borrow cheap money to finance the then-future. Today the consumer is faced with higher borrowing costs, eroding value of money due to inflation, and an erratic macro-environment that will undoubtedly lead to some form of negative consumer entrenchment.

Data Source: St. Louis Fed Economic Data
Fixed Income Markets in Uncertain Macroeconomic Environments
“On the one side, we have all these crises coming together; on the other side a system that is even less able to deliver than it has been in the past.”
— Masood Ahmed, a former IMF and World Bank official who now leads the Center for Global Development
Record inflation and macroeconomic uncertainty are being reflected in the largest capital market in the world; the bond market. In order to visualize this, we can study the yield curve and derivatives of the yield curve called spreads.
To understand the yield curve and its spreads, it is first important to have a basic understanding of bonds and bond yields. A bond’s yield is how much it will return by buying that bond and holding it to expiration.
In most cases, a bond’s value at expiration is predetermined. This is known as its face value. If investors are selling bonds and the price is falling, then an investor will gain more by buying and holding until expiration to receive the face value and all coupon (interest) payments that come with it.
Therefore, when bond prices are falling their yields are rising.
Longer duration bonds generally have higher yields than short duration bonds. This makes sense because, for example, if investors are going to have our money tied up for 10+ years you’d expect to get a higher return than if it was only for 1 or 2 years.
What is the yield curve?
So now we can begin to understand the yield curve. The yield curve compares the yields of several different duration (maturity) US treasury bonds. Normally the yield curve is upward sloping, as investors expect more returns for having their money tied up longer.

In a healthy economy, the yield curve has a logarithmic slope, as you can see above. This means as maturity rises, so does the yield, at a decreasing rate. When the economy weakens, we tend to see the curve straightening as all the yields are moving closer to becoming equal, this is called yield curve flattening. In a fairly rare phenomenon, the curve can become inverted as the yields of short-term bonds are higher than the yields of the longer maturity bonds, but more on this later.
In the 2nd quarter of 2022, the yield curve continues to flatten, as we’ve seen for the last year.

Data Source: Bloomberg
Above is a screenshot from Bloomberg showing us the current yield curve. As you can see, the upper end of the curve appears quite flat as the curve moves closer to inversion.
Variations in the yield curve can say a lot about the current economic environment. Analysts often compare two specific maturity bonds to each other in order to quickly gauge the slope of the yield curve and the health of the US economy.
What is a yield spread?
The comparison of two different maturity bonds is done by subtracting the yield of the longer-term bond from the yield of the shorter-term bond. This value is called a yield curve spread. (YC Spread = LT Bond Yield - ST Bond Yield)
A yield curve spread gives us an idea of economic health as it allows us to gauge the expectations of market participants. When the spread is falling, it shows us that people are becoming increasingly nervous about future economic conditions. If the spread falls below 0.00, meaning the yield of the shorter maturity bond is greater than the long-term bond, this signals yield curve inversion.
The impacts of a yield curve inversion are more than just signaling economic weakness. As short-term bond yields rise, banks are forced to raise interest rates on consumer loans like mortgages and auto loans thus decreasing many people’s savings, which decreases investment and ultimately productivity.
Furthermore, many companies and banks earn interest by borrowing money at low short-term rates and lending out money at high longer-term rates. When the short and long-term rates are close to equal, or even inverted, it compresses profit margins.
This logic is simple: Investors expect the Fed to increase interest rates in the short term so much (to fight inflation) that it ends up squeezing credit, causing a recession and ultimately leading to lower interest rates in the future. In the last 80 years, the 2-10Y spread has accurately predicted every US economic recession. Only once did it give us a false flag, this was in 1966 when there was an economic drawdown but not a full-blown recession.
Inverting Yield Curve

Data Source: St. Louis Fed Economic Data
Above is the 2-10Y spread overlaid with shaded sections showing US recessions. This points out the biggest key to yield curve inversion. As you can see above, a negative 2-10Y spread usually signals an incoming recession, but it’s not saying that one will start immediately.

The last 5 times the curve inverted, the economy didn’t go into a recession until, on average, 43 weeks (nearly 11 months) later. This gave the Nasdaq Composite enough time to put in an average of a 50.5% gain before topping.
Additionally, in every instance, the Nasdaq was positive for the two months following the 2-10Y inversion, with an average gain of nearly 7%. When we look at the hard data, it’s clear that something could be coming, but it isn’t a cause for immediate panic.
There is also much debate whether the 2-10Y spread is the best in predicting recessions. Comparing the 10-year or 30-year to the 3-month or 1-year are some other common spreads used as measuring sticks.

Data Source: St. Louis Fed Economic Data
As you can see above, the 2-10Y spread flipped negative on April 1st for a short period of time. It has since recovered by 39 bps but the risk of inversion and the damage it can cause is omnipresent.
As previously mentioned, in order to fight inflation the Fed can raise rates, as they have already begun to do. The difference between 2022 and all other curve inversions in the past is that the Fed has already reached the lower limit of the fed funds rate.
This means that in order to stop the yield curve from inverting, the Fed must lower interest rates, as they did in 2007. But in order to lower inflation, the Fed must raise interest rates. But the fed funds rate is only at 25 basis points, meaning there’s no room to lower interest rates in order to save the bond market.
Sharp Rise in Mortgage Rates

Data Source: Bloomberg
Some of the effects of an inverted yield curve are already underway in the housing market. As mentioned previously, high short-term interest rates can cause banks to increase interest rates on consumer loans. The above chart shows 30-year mortgage rates which recently surpassed 5.25% for the first time since 2009.
At the end of the day, if a credit contraction occurs causing a recession, the response would likely be the same as the decades before. The Federal Reserve would drop rates to zero, potentially even negative like Europe and Japan have done, and the US would continue to pass multi-trillion dollar stimulus packages.
High US Public Debt Leads to USD Devaluation

We can visualize the over-leveraging of debt using the chart above. The debt-to-GDP ratio is a commonly used metric to judge the overall amount of public debt in the economy in comparison to the economic value produced by the country.
In a fiat monetary system, governments don’t usually default on debt in a traditional sense. Instead, unpaid debts are settled by the printing of currency to buy government bonds.
This leads to widespread inflation as the monetary units grow faster than the economic output of the country. Therefore, those bondholders who are repaid will be paid in a weakened currency thus losing purchasing power.
Monetary inflation is an attack on the purchasing power of those citizens and businesses who hold cash, bank deposits, or fixed-income securities. This means that, in turn, this debt will be paid by those who are unable to grow their cash flows faster than the rate of inflation.
Historical Performance of Commodities and Equities in Uncertain Macro Environments & Inflationary Periods
As noted above, uncertainty and inflation in the US are starting to heat up to record levels.
If the global macro environment does lead to a relatively inflationary decade for the rest of the 2020s, it is helpful to use history as a guide to see how commodities have fared during these turbulent periods.
Below is a chart that highlights the two common indices used to measure commodity prices back in 1981. The chart itself is pulled from the Bank of England’s Quarterly bulletin published in March 1981. Post-World War II, commodity prices remained nominally stationary for over two decades until President Nixon ended the Gold standard in 1971. That was the catalyst for a roaring commodities bull market and high consumer price inflation.

Data Source: Bank of England Quarterly Bulletin, March 1981
During that inflationary decade, one of the best-performing commodities was gold. The US Dollar was historically backed by gold because it is a scarce monetary instrument with no counterparty risk.
Due to gold's unique monetary properties of scarcity, durability, and fungibility, investors rushed into this asset to protect their quickly inflating US Dollars. Because of gold’s extreme scarcity (relative to all other currencies and commodities that existed at the time), investors could bid the price higher, store wealth in the asset, and not worry about the price crashing caused by a significant amount of new supply being mined.
Because of gold’s unique monetary properties and the inflationary macroeconomic conditions, the price of gold increased over 18x in only ten years.
Gold 1971 - 1982

Data Source: Bloomberg
In comparison, the S&P 500 had a very poor decade. Equities were mostly flat with volatile swings in nominal terms. In real terms, after accounting for the high inflation, equities were down significantly in relation to the buying power the assets possessed before 1970. Below you can see the S&P 500 (white) overlayed with the consumer price index (red).
After analyzing the performance of a traditional equity portfolio versus the return of a scarce hard commodity, the scarce commodity historically had the upper hand.
S&P 500 vs. CPI 1971 - 1982

Data Source: Bloomberg
Allocating Capital During an Uncertain Inflationary 2020s
If consumer price inflation and asset price inflation continue as they have since early 2020, it is important to position your portfolio in a manner that captures large potential upside while reducing unnecessary long-term risk.
There are many similarities between the inflationary period of the 1970s and the 2020s, but there is now a new tool that exists for investors. That tool is Bitcoin.
Bitcoin, like gold, is a hard, scarce commodity with no counterparty risk, meaning if you hold it yourself, you do not have to trust any other entity to custody (like gold), pay you back (like fixed income), or run a company (like equities). Bitcoin is different from gold in the sense that you have immutable perfect scarcity.
More gold gets mined year after year, but there will never be more than 21,000,000 BTC. Bitcoin has no dilution risk, unlike any other asset. As the price of gold rises there is more incentive to mine gold and increase its supply. With bitcoin, this is functionally impossible.
Not only does Bitcoin have superior monetary properties compared to gold, but it is also disruptive new technology on the cusp of mass adoption. This disruptive technology is starting to gain serious global traction at the same time as the incoming supply is exponentially decreasing. By 2030, ~ 97% of all Bitcoin will be in circulation.

Bitcoin clearly has a role to play in the modern portfolio, but its high returns and early adoption come at the expense of significant short-term volatility.
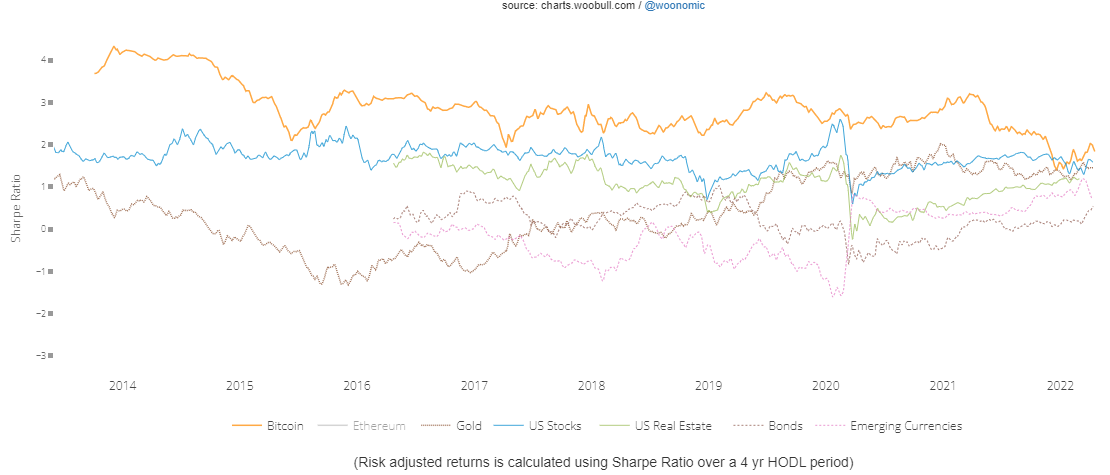
Bitcoin’s Sharpe Ratio
Many investors are confident that Bitcoin will outperform most asset classes on a 4+ year time horizon, but the high potential returns come at the expense of short-term volatility.
There is a metric in finance called the Sharpe Ratio that can be used to calculate Bitcoin’s historical risk-adjusted returns. Meaning, after accounting for volatility and short-term risk, is the return justified?
Looking at a 4-year holding period, Bitcoin’s Sharpe ratio is historically almost always higher than all other major asset classes including gold, US stocks, US real estate, bonds, and emerging currencies.
While the 4-year holding period Sharpe ratio validates that the short-term volatility can be justified by the large returns, that doesn’t mean investors want to stomach that short-term volatility.
What if it was possible to still capture a large amount of the future upside and reduce short-term volatility risk, all while earning a positive daily BTC “dividend”?
Mining Bitcoin
An S19XP, Bitmain’s newest generation Bitcoin mining rig being released in July, currently would have an operating margin of ~80%. Plugged in, the machine would cost $5.42 to run (at $0.075 kWh), and it would mine $26.60 worth of Bitcoin every day at the current BTC price and network difficulty.
Mining Bitcoin becomes increasingly interesting in an inflationary environment. Due to the nature of energy contracts with utilities, miners can lock in their electricity rate for a number of years. This means you can keep your operating expenses fixed while prices of virtually everything else, including Bitcoin are likely to be increasing over time.
If you are buying a new generation machine, the value of the new machine historically has a beta of 0.96 compared to Bitcoin (Hashrate Index Research). While it tracks the volatile price of Bitcoin, it continues to earn a consistent daily cash flow regardless of daily fluctuations.
These daily positive cash flows will likely persist even under extreme short-term (12-18 months) volatility. As noted in this Blockware Intelligence Research Report, new generation mining rigs behave as safe haven Bitcoin dividend assets. If the price of Bitcoin falls significantly, older less efficient rigs become unprofitable first, they turn off, difficulty drops, and new generation machines begin earning more Bitcoin.
Bitcoin Mining in Practice
While the Bitcoin mining case is compelling, it is difficult to procure ASICs, build large mining facilities, and source cheap scalable electricity all on your own. As an institution, hedge fund, or high net worth individual, it makes sense to purchase and host ASICs with a trusted partner like Blockware Solutions.
With Bitcoin mining experience dating back to 2013, Blockware Solutions has sold over 250,000 ASICs, hosted 200+ MW of clients, and mined thousands of BTC from the Blockware Mining Pool.
If you are looking for a trusted partner to assist you in deploying capital to the Bitcoin mining space, Request a Quote from Blockware Solutions.
All content is for informational purposes only. This Blockware Intelligence Research Report is of a general nature and does consider or address any individual circumstances and is not investment advice, nor should it be construed in any way as tax, accounting, legal, business, financial or regulatory advice. You should seek independent legal and financial advice, including advice as to tax consequences, before making any investment decision.
Blockware Intelligence Research Team
Joe Burnett, Analyst; Blake Davis, Crypto-Equity Analyst; Will Clemente Lead Insights Analyst; Mitchell Askew, Graphics; Warren Rogers, Chief Financial Officer; Sam Chwarzynski, CIO & Head of Research; Mason Jappa, Chief Executive Officer